Tree Layout
Overview
Tree layout algorithms are sophisticated algorithms that organize hierarchical data in a structured and comprehensible format. These algorithms are pivotal in a multitude of domains, from genealogy to organizational structures, and especially in software engineering where understanding the parent-child relationships within data is crucial.
At the core of these algorithms lies the family tree analogy, where individuals are connected to their ancestors and descendants. This connection is not merely a representation of familial ties but extends to any entity that can be structured in a hierarchical manner. The tree layout algorithm meticulously organizes these connections to ensure clarity and coherence. It positions progenitors above their descendants, akin to the branches of a tree, providing an intuitive visualization of relationships with the passage of time flowing from top to bottom.
The concepts of ‘child’ and ‘parent’ nodes in tree structures are universal. A ‘child node’ is identified by an incoming edge, while a ‘parent node’ is defined by an outgoing edge to a child. This directional flow is a defining characteristic of tree layouts, often dictating the orientation of the structure itself. For example, a family tree typically exhibits a top-to-bottom orientation, mirroring the natural flow from ancestors to descendants.
A ‘root’ node is often the starting point in tree layouts, representing the origin of the hierarchy. The selection of the root can be context-driven, such as a CEO in an organizational chart, or determined through algorithmic criteria, favoring nodes with multiple outgoing edges over terminal nodes, or ‘leaves’.
yFiles has several tree layout algorithms, each tailored to specific visualization needs:
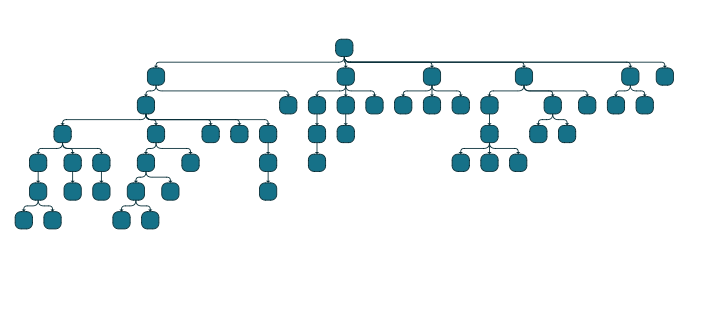
- Classic Tree Layout: Offers a traditional, tiered representation with horizontal levels and vertical alignment of child nodes beneath their parents.
- Tree Layout: Builds upon the classic style, potentially integrating additional design elements or variations in node arrangement.
- Balloon Tree Layout: Adopts a radial arrangement, placing the root at the center and allowing child nodes to branch outwards, resembling the spokes of a wheel.
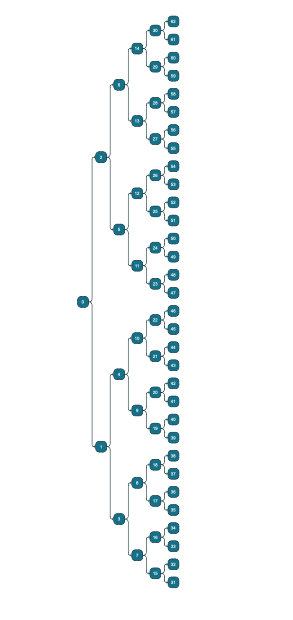
- Aspect Ratio Tree Layout: Prioritizes maintaining a consistent aspect ratio, ensuring the tree’s dimensions are balanced, which is beneficial for diverse display environments.
Each style provides a unique perspective on hierarchical data, enabling the selection of the most fitting layout to effectively convey the underlying structure and relationships within the data.
Features
Sorting child nodes
The tree layout algorithms enable the organization of child nodes within a subtree by utilizing a NodeOrderComparer. This is done in association with a data provider that is linked to the graph through a designated lookup key.
Using non-tree graphs
If your data is not an actual tree-graph you can convert it to a tree (actually projection or sub-graph of the original) via the TreeReductionStage. This class serves as a layout phase that converts graphs into structured trees. It is designed to automatically eliminate any edges that do not form part of the tree before the start of an algorithm’s execution and then reinsert them afterwards. Upon reinsertion of the edges, a variety of routing styles may be implemented.
Edge bundling
The TreeReductionStage class incorporates a routing style known as edge bundling to streamline the visualization of graphs. This technique organizes the paths of non-tree edges within a diagram, aligning them along common trajectories.
The adoption of edge bundling is instrumental in decluttering the graphical representation of expansive graphs that contain numerous edges. It enhances the clarity of the drawing, allowing for the prominent display and easy identification of overarching patterns in edge pathways and the interconnections among various node clusters. The utility of edge bundling extends across multiple fields, including bioinformatics, where it aids in the analysis of complex biological networks; social network analysis, where it helps visualize the intricate web of social connections; telecommunications, where it can simplify the layout of vast communication networks; and fraud detection, where it assists in uncovering patterns indicative of fraudulent activity.
In the context of TreeReductionStage, edge bundling is specifically applied to non-tree edges, facilitating a more organized and interpretable diagram structure. This not only improves the aesthetic appeal of the graph but also contributes to a more intuitive understanding of the data’s underlying structure and relationships.
Labeling
Besides the generic labeling support which is available in all yFiles layout algorithms, generic tree layout additionally features integrated labeling. Integrated labeling is available for node labels and edge labels. They are taken into consideration when determining the shape of a subtree. With this strategy it is guaranteed that no label will overlap other objects in the diagram.
Groups
By design, the TreeLayout algorithm facilitates the arrangement of tree structures, encapsulating entire subtrees within group nodes. It computes both the placement and size of these group nodes. The functionality to manage this feature is provided by the setGroupingSupported property.
Incremental layout
While a traditional layout algorithm requires recomputing an entirely new graph layout each time it is invoked, incremental layout modifies only specific parts of the graph while the remainder remains largely unchanged. This approach enables users to maintain a consistent mental map of a changing graph over multiple layout iterations, particularly in interactive scenarios where the user makes frequent modifications to the graph.
The term mental map refers to a user’s subjective experience of a graph, which is significantly influenced by the consistent and largely unvarying placement of graph elements across multiple layout calculations. This consistency allows users to quickly and easily navigate the graph, as they are able to rely on familiar patterns of element placement and connection. In contrast, a traditional layout algorithm would require users to relearn the layout of the graph each time it is modified, leading to increased cognitive load and decreased user satisfaction.
Incremental layout algorithms, on the other hand, enable users to maintain a consistent mental map of the graph over multiple layout iterations, even as the graph itself changes. This approach allows users to quickly adapt to changes in the graph, without having to relearn the layout of the graph each time it is modified. As a result, incremental layout algorithms can improve user satisfaction and reduce cognitive load in interactive scenarios where the graph is frequently modified.️
Node halos
TreeLayout by default provides support for node halos, taking into account any additional padding specified around nodes and ensuring that surrounding areas remain free from other graph elements. This means that labels on a node and adjacent edge segments are not affected and can still be placed inside or across the node’s halo as desired.
Multiple parents
The TreeLayout algorithm is uniquely equipped to handle complex multi-parent structures. In these configurations, several nodes are linked by common direct predecessor and successor nodes. The algorithm also extends its support to multi-parent structures housed within group nodes. It is crucial to ensure that all nodes part of the same multi-parent structure are grouped under a single group node.
While multi-parent structures deviate from the traditional definition of a tree graph, the TreeLayout algorithm adeptly manages them within the framework of tree graphs.
Compactness
The compactness factor endeavors to refine the placement of child nodes around each tree node, aiming to position each subtree in proximity to its root while adhering to the designated wedge angle and avoiding encroachment upon neighboring subtrees. When the compactness factor values are elevated, the optimization process adopts a more lenient approach, permitting suboptimal arrangements. Conversely, diminished factor values signal the optimization to persist until it approaches an optimal state. Note that, therefore, reduced values may result in an extended runtime.
Layout
Starting from the Leaves: The algorithm initiates the layout process at the leaf nodes, which are the nodes at the furthest end of the tree with no children. This bottom-up approach ensures that the layout of the child nodes informs the positioning of their parent nodes.
Processing Parent Nodes: After arranging the leaves, the algorithm proceeds to their immediate parents, then to the parents of those parents, and so on, moving up the hierarchy. This step-by-step progression is crucial for maintaining the tree’s structure and hierarchy.
Node Placement: As each node is processed, the algorithm employs an ITreeLayoutNodePlacer instance. This placer is responsible for:
- Moving the node’s children and their subtrees to an appropriate location that reflects their hierarchical relationship.
- Routing the outgoing edges from the node to its children, ensuring that the edges are drawn in a way that reflects the tree’s structure without unnecessary crossings or confusion.
Local Root Processing: Once a node and its subtree are appropriately placed, the algorithm moves on to the next local root node. A local root node is typically the next node up in the hierarchy that hasn’t been processed yet.
Utilizing SubtreeShapes: To prevent the need for multiple relocations of nodes and to understand the space requirements of the subtrees, the algorithm makes use of SubtreeShapes. These are abstract representations of the space a subtree occupies. By moving and merging these shapes during the layout calculation, the algorithm can:
- Minimize the number of times nodes are moved.
- Accurately predict the area needed for each subtree.
- Ensure that subtrees do not overlap and that there is sufficient space between them.
Optimization: Throughout the process, the algorithm optimizes the layout for various factors, such as:
- Minimizing edge lengths to keep related nodes close together.
- Reducing the number of edge crossings to improve readability.
- Balancing the distribution of nodes to create a harmonious and organized appearance.
Final Layout: The end result is a tree graph where each node is positioned in a way that reflects its hierarchical level and relationship to other nodes, with edges routed cleanly and clearly to connect parent nodes to their children.
Business Domains
Information Technology: In the realm of IT, tree layouts are pivotal for organizing Active Directory configurations. They provide a visual framework for the hierarchical structure of domains, organizational units, and user groups, which is essential for managing network resources, security policies, and user permissions.
Network Design: Tree layouts are instrumental in designing network topologies. They help network engineers visualize and plan the architecture of networks, particularly in large organizations where the efficient structuring of domains, trees, and forests is critical for ensuring secure and accessible network services.
Software Engineering: Within software development, tree layouts are utilized to depict object-oriented hierarchies or class inheritance structures. This visual representation aids developers in understanding and managing the relationships between different software components, enhancing code maintainability and scalability.
Data Visualization: Tree layouts play a significant role in data visualization, especially for illustrating data structures like binary trees, B-trees, and other hierarchical models. These layouts help computer scientists and database architects comprehend the underlying structure of data storage and retrieval mechanisms.
Project Management: In project management, tree layouts are used to create Work Breakdown Structures (WBS). These structures break down a project into smaller, more manageable pieces, facilitating better organization, tracking, and allocation of resources throughout the project lifecycle.
Bioinformatics: In bioinformatics, tree layouts are crucial for constructing phylogenetic trees. These trees map out the evolutionary relationships among species or genes, providing insights into genetic lineage and evolutionary biology.
User Interface Design: Tree layouts are beneficial in UI/UX design for structuring navigation menus and site maps. They offer a clear and intuitive organizational scheme for user interfaces, improving the user experience by making information easily accessible.
Financial Modeling: In the financial sector, tree layouts are employed to construct decision trees. These trees assist in the visualization of decision-making processes, outlining potential outcomes and the likelihood of various scenarios, which is invaluable for risk assessment and strategic planning.
Technical Details
Data
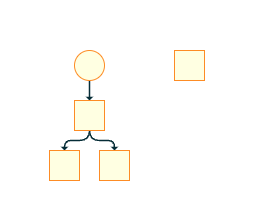
There are various ways one can create a graph for some given tree-data. The yFiles framework has a dedicated TreeBuilder (a special version of the GraphBuilder) which allows you to assemble a tree like so:
const treeBuilder = new TreeBuilder(graph)
const rootNodesSource = treeBuilder.createRootNodesSource([
  {
    id:"Root 1"
  },
  {
    id: "Root 2",
    children:[
      {
        id:"Child 2.1",
        children:[
          {
            id:"Child 2.1.1"
          },
          {
            id:"Child 2.1.2"
          }
        ]
      }
    ]
  }
])
rootNodesSource.nodeCreator.defaults.style = new ShapeNodeStyle({
  stroke: "DarkOrange",
  fill: "LightYellow"
})
rootNodesSource.nodeCreator.defaults.shareStyleInstance = false

rootNodesSource.nodeCreator.styleBindings.addBinding('shape', (u) =>
  u.children?.length > 0 ? 'ellipse' : 'rectangle'
)
const childrenSource = rootNodesSource.createChildNodesSource(
  (n) => n.children
)

childrenSource.addChildNodesSource((n) => n.children||[], rootNodesSource)
childrenSource.nodeCreator.styleBindings.addBinding('shape', (u) =>
  u.children?.length > 0 ? 'diamond' : 'ellipse'
)
treeBuilder.buildGraph()

// graph.applyLayout(new TreeLayout())
Playgrounds
▸ Simple tree layout of a random generated tree
This is the basic setup with a little zoom animation on clicking of a particular node.
const nodeCount = 50;

const nodes: INode[] = [graph.createNode()]
for (let i = 1; i < nodeCount; i++) {
  nodes.push(graph.createNode())
  graph.createEdge(nodes[Math.floor(Math.random() * (i - 1))], nodes[i])
}
const inputMode = graphComponent.inputMode as GraphViewerInputMode
inputMode.addItemClickedListener((src, { item }) => {
  if (item instanceof INode) {
    graphComponent.zoomToAnimated(item.layout.center, 7)
  }
})
await graphComponent.morphLayout(new TreeLayout({ }), '1s')Very similar to previous playground, but in this case the node-click turns the clicked into the new root of the layout.
//============================================================
// Dynamically changing the layout root in the TreeLayout.
//============================================================

const nodeCount = 50;

const nodes: INode[] = [graph.createNode()]
for (let i = 1; i < nodeCount; i++) {
  nodes.push(graph.createNode())
  graph.createEdge(nodes[Math.floor(Math.random() * (i - 1))], nodes[i])
}
const inputMode = graphComponent.inputMode as GraphViewerInputMode
let treeRoot = nodes[0]
inputMode.addItemClickedListener((src, { item }) => {
  if (item instanceof INode) {
    treeRoot = item as INode;
    graphComponent.morphLayout(new TreeLayout(), '1s', new TreeLayoutData({
  treeRoot:treeRoot
}));
  }
})

graphComponent.morphLayout(new TreeLayout(), '1s')
▸ Tree layout with a non-tree and reduction stage

const nodeCount = 50;

const nodes: INode[] = [graph.createNode()]
for (let i = 1; i < nodeCount; i++) {
  nodes.push(graph.createNode())
  graph.createEdge(nodes[Math.floor(Math.random() * (i - 1))], nodes[i])
}

// turn the tree into a non-tree
// the 0-node is the root
graph.setStyle(graph.nodes.get(0), new ShapeNodeStyle({fill:"red"}))
// add two edges breaking the tree
graph.createEdge(graph.nodes.get(0), graph.nodes.get(14))
graph.createEdge(graph.nodes.get(10), graph.nodes.get(14))

// without this reduction the balloon layout would fail
const treeReductionStage = new TreeReductionStage()
const ebc = treeReductionStage.edgeBundling
      ebc.bundlingStrength = .1
      ebc.defaultBundleDescriptor = new EdgeBundleDescriptor({
        bundled: true
      })
// both balloon and tree layout will now work since they overlook the breaking edges
const layout = new TreeLayout({

   orientationLayoutEnabled:true,
   layoutOrientation:"top-to-bottom"
    });
layout.appendStage(treeReductionStage);
await graphComponent.morphLayout(layout, '1s')
▸ Tree layout with graph builder and tree generator
  class GraphGenerator {
    /**
     * Defines the way the algorithms create a node for a given index.
     * @param i {number} The index of the node.
     * @returns {{ id: string}}
     */
    static nodeCreator = (i) => {
        return { id: i.toString() };
    };

    /**
     * Defines the way the algorithms create an edge for a given edge.
     * @param i {number} Source index.
     * @param j {number} Target index.
     * @returns {{sourceId: string, targetId: string}}
     */
    static edgeCreator = (i, j) => {
        return { sourceId: i.toString(), targetId: j.toString() };
    };

    /**
     * Simple balanced tree
     *
     * @memberof RandomGraph
     * @param {number} childrenCount number of children each node has
     * @param {number} height height of the tree
     */
    static BalancedTree(childrenCount = 3, height = 3) {
        let v = 1;
        const jsonGraph = {
            typeName: 'Graph',
            nodes: [GraphGenerator.nodeCreator(0)],
            edges: [],
        };
        let newLeaves = [],
            node,
            leaves;

        for (let i = 0; i < childrenCount; i++) {
            ++v;
            node = GraphGenerator.nodeCreator(v - 1);
            jsonGraph.nodes.push(node);
            newLeaves.push(node);
            jsonGraph.edges.push(GraphGenerator.edgeCreator(0, v-1));
        }

        for (let h = 1; h < height; h++) {
            leaves = newLeaves;
            newLeaves = [];
            for (let j = 0; j < leaves.length; j++) {
                for (let i = 0; i < childrenCount; i++) {
                    ++v;
                    node = GraphGenerator.nodeCreator(v - 1);
                    newLeaves.push(node);
                    jsonGraph.nodes.push(node);
                    jsonGraph.edges.push(GraphGenerator.edgeCreator(leaves[j].id, v - 1));
                }
            }
        }
        return jsonGraph;
    }


}
graph.nodeDefaults.labels.style = new DefaultLabelStyle({backgroundFill:null, textFill:"white"})
const data = GraphGenerator.BalancedTree(2,5);
const builder = new GraphBuilder(graph);
builder.createNodesSource({
  data: data.nodes ,
  id: "id",
  labels:["id"]
})
builder.createEdgesSource({
  data: data.edges,
  sourceId: "sourceId",
  targetId: "targetId"
})
builder.buildGraph()


await graphComponent.morphLayout(new TreeLayout({layoutOrientation:"left-to-right"}), '1s')This shows how to use create a tree via the TreeBuilder.
const treeBuilder = new TreeBuilder(graph)
const rootNodesSource = treeBuilder.createRootNodesSource([
  {
    id:"Root 1"
  },
  {
    id: "Root 2",
    children:[
      {
        id:"Child 2.1",
        children:[
          {
            id:"Child 2.1.1"
          },
          {
            id:"Child 2.1.2"
          }
        ]
      }
    ]
  }
])
rootNodesSource.nodeCreator.defaults.style = new ShapeNodeStyle({
  stroke: "DarkOrange",
  fill: "LightYellow"
})
rootNodesSource.nodeCreator.defaults.shareStyleInstance = false

rootNodesSource.nodeCreator.styleBindings.addBinding('shape', (u) =>
  u.children?.length > 0 ? 'ellipse' : 'rectangle'
)
const childrenSource = rootNodesSource.createChildNodesSource(
  (n) => n.children
)

childrenSource.addChildNodesSource((n) => n.children||[], rootNodesSource)
childrenSource.nodeCreator.styleBindings.addBinding('shape', (u) =>
  u.children?.length > 0 ? 'diamond' : 'ellipse'
)
treeBuilder.buildGraph()

graph.applyLayout(new TreeLayout())