Balloon Layout
Overview
The balloon layout shares many similarities with the tree layout, but there are key distinctions. Let’s explore them:
Tree Layout:
- Suitable when the input graph is a tree or a collection of trees.
- A tree is a graph without undirected cyclic edge paths.
- If the input graph isn’t a tree, it’s temporarily transformed into one by removing some edges
- Organizes nodes in a horizontal/vertical fashion.
Balloon Layout:
- Requires a tree or a collection of trees as input.
- Routes the tree in a quasi-radial style (balloon style).
- Ideal for undirected, dense, or huge trees with many nodes on a single hierarchy level.
- Articulates a radial direction, resembling a balloon.
The choice between tree and balloon layouts depends on the data type and business domain.
When to Choose Balloon Layouts:
- Data Type:
- When you want to highlight key elements within a dataset.
- Useful for displaying weighted tags or concepts.
- Business Domain:
- In contexts where emphasizing specific nodes is crucial.
- For visualizing popularity, frequency, or impact.
- Advantages:
- Draws attention to significant nodes.
- Effective for conveying relative importance.
- Aesthetically appealing.
Features
Integrated Edge and Node Labeling:
- The algorithm incorporates both edge labeling and node labeling. These labels are automatically placed without causing overlaps with other labels or graph elements.
- Node labels can be positioned in various ways, ensuring readability and clarity.
Preferred Wedge Angle:
- Defining a preferred wedge angle significantly impacts the layout style.
- Subtrees rooted at a node receive a specific amount of radial space around the parent node.
- A preferred angle close to 360 degrees results in drawings where subtrees resemble balloons, while an angle near 180 degrees creates drawings resembling semicircles.
BalloonLayout for Large Tree Graphs:
- BalloonLayout is computationally efficient and well-suited for large tree graphs.
- It performs admirably even for huge graphs.
Node Type Considerations:
- Node types play a role in sorting child nodes of a local root node.
- Nodes of the same type are placed consecutively if possible.
- While a custom comparer can influence sorting, node types take precedence over the childOrderingPolicy.
Graph Structure Limitation:
- This layout algorithm exclusively handles graphs with a tree structure.
- To apply it to a general graph, consider appending a TreeReductionStage. This stage temporarily removes some edges from the input graph until a tree structure is achieved. The removed edges are later reinserted and routed separately.
Business domains
Software Engineering: In the realm of software engineering, BalloonLayout is instrumental for visualizing hierarchical data structures within software architecture. This visualization technique is particularly useful for understanding and managing the complex interdependencies of system components. By representing these structures in a hierarchical manner, software engineers can easily identify parent-child relationships between classes or modules, assess the impact of changes, and optimize the overall design for better maintainability and scalability.
Network Design: Network designers often employ BalloonLayout to represent network topologies. The layout’s compact and radial arrangement is ideal for depicting how nodes (such as routers, switches, and hubs) are interconnected within a network. This visual representation aids in the analysis of network performance, the identification of potential bottlenecks, and the planning of network expansions or reconfigurations to improve efficiency and reliability.
Bioinformatics: BalloonLayout finds a significant application in bioinformatics for displaying phylogenetic trees and other biological data. Phylogenetic trees illustrate the evolutionary relationships among various species or genes. By using BalloonLayout, researchers can present these trees in a clear and concise manner, making it easier to trace lineage connections, compare genetic distances, and infer evolutionary patterns.
Database Design: In database design, BalloonLayout is utilized to illustrate relationships in entity-relationship diagrams (ERDs). ERDs are crucial for conceptualizing the database structure, showcasing the entities (tables), their attributes (columns), and the relationships (keys) between them. BalloonLayout helps in organizing these diagrams in a way that highlights the primary entities and their connections, facilitating a better understanding of the database schema and ensuring the integrity of data relationships.
Layout
Conceptually, the layout goes as follows:
- Selecting the Root Node:
- The algorithm begins by choosing a root node based on the specified root policy.
- Placing Subtrees Around the Root:
- Using a bottom-up recursive approach, the algorithm determines the placement of subtrees around the root. It starts with the leaf nodes.
- For each leaf node, the convex hull of that node is calculated.
- For non-leaf nodes, the children rooted at the node are arranged. These children are sorted according to a specified ordering policy, and a distance to their parent is chosen.
- The chosen distance ensures that subtrees rooted at the current node fit into the preferred wedge angle. The wedge angle defines how much radial space a subtree occupies around its parent, and it is computed using the convex hulls of the subtrees.
- Updating Convex Hulls:
- Finally, the convex hull of the subtree rooted at the current node is updated. This update includes all the convex hulls of the child nodes.
- This update is possible because the distances and wedges of the child subtrees are now known.
- Assigning Node Coordinates:
- The actual coordinates of nodes are assigned using a recursive approach, starting with the root node.
Playgrounds
▸ Check that a graph is a tree
yFiles has a utility class called GraphStructureAnalyzerhelping with analyzing whether a graph is planar, acyclic…and also whether your graph is a tree. For some layout algorithms you need to make sure your data is tree-like and this snippet shows how you can use the GraphStructureAnalyzer to do that:
const nodeCount = 100;
const nodes: INode[] = [graph.createNode()]
for (let i = 1; i < nodeCount; i++) {
nodes.push(graph.createNode())
graph.createEdge(nodes[Math.floor(Math.random() * (i - 1))], nodes[i])
}
const inputMode = graphComponent.inputMode as GraphViewerInputMode
inputMode.addItemClickedListener((src, { item }) => {
if (item instanceof INode) {
graphComponent.zoomToAnimated(item.layout.center, 7)
}
})
const analyze = new GraphStructureAnalyzer(graphComponent.graph);
if(analyze.isTree()){
await graphComponent.morphLayout(new TreeLayout({ }), '1s')
}else{
alert("It's not a tree graph.")
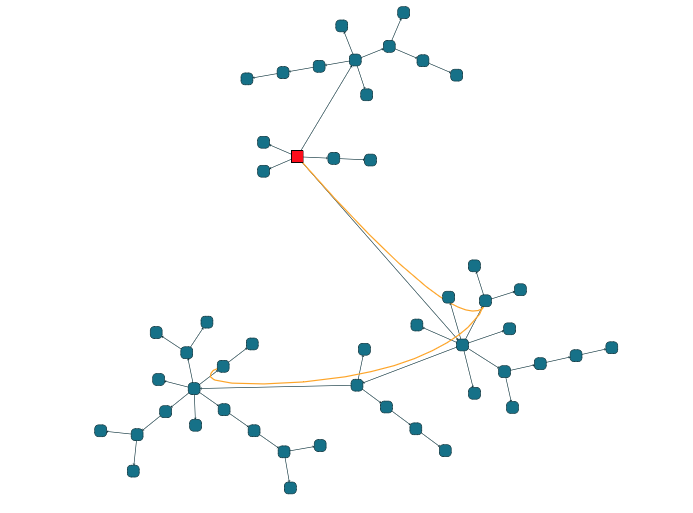
}▸ Balloon layout with a non-tree and reduction stage
If your data is not a tree you can still use a tree-specific layout algorithm by invoking a tree reduction stage (see the TreeReductionStage class):
const nodeCount = 50;

const nodes: INode[] = [graph.createNode()]
for (let i = 1; i < nodeCount; i++) {
  nodes.push(graph.createNode())
  graph.createEdge(nodes[Math.floor(Math.random() * (i - 1))], nodes[i])
}

// turn the tree into a non-tree
// the 0-node is the root
graph.setStyle(graph.nodes.get(0), new ShapeNodeStyle({fill:"red"}))
// add two edges breaking the tree
graph.createEdge(graph.nodes.get(0), graph.nodes.get(14))
graph.createEdge(graph.nodes.get(10), graph.nodes.get(14))

// without this reduction the balloon layout would fail
const treeReductionStage = new TreeReductionStage()
const ebc = treeReductionStage.edgeBundling
      ebc.bundlingStrength = 1
      ebc.defaultBundleDescriptor = new EdgeBundleDescriptor({
        bundled: true
      })
// both balloon and tree layout will now work since they overlook the breaking edges
const layout = new BalloonLayout({
  compactnessFactor:1.0,
   orientationLayoutEnabled:true,
   layoutOrientation:"top-to-bottom"
    });
layout.appendStage(treeReductionStage);
await graphComponent.morphLayout(layout, '1s')