Tabular Layout
Overview
The TabularLayout class is a layout algorithm designed to arrange nodes within a diagram in a structured, table-like format. This algorithm is particularly suited for creating straightforward, grid-based layouts where the nodes are positioned in an orderly manner, akin to data organized within a spreadsheet.
This layout is somewhat different from our other layout algorithms:
Single Node Per Cell: The fundamental principle of the
TabularLayoutis that each cell within the table can house no more than a single node. This ensures that the layout remains clean and uncluttered, with each node distinctly separated from its neighbors by the boundaries of the cells.Node Connectivity Disregarded: In the process of arranging the nodes, the
TabularLayoutdoes not take into account the connections or relationships between nodes. The primary focus is on the placement of the nodes rather than the inter-node links, which means that the layout algorithm treats each node independently of others.Edge Routing Not Applied: Unlike some other layout algorithms that may route the edges or connections between nodes to avoid overlaps and ensure clarity, the
TabularLayoutdoes not involve any such edge routing. The edges, if present, are not manipulated or repositioned by this algorithm.
For scenarios requiring more intricate table layouts that include edge routing and other advanced features, the PartitionGrid - yFiles for HTML 2.6 Documentation (yworks.com) is the way to go. The PartitionGrid class is a versatile tool designed to facilitate the creation of partitioned layouts, including tabular layouts and the more specialized swimlane layouts. This class is instrumental in defining a structured grid system composed of rows and columns, which in turn form the individual cells of the grid:
Grid Formation: At its core, the
PartitionGridclass is responsible for establishing a grid framework. This grid is delineated by its rows and columns, creating a matrix of cells. Each cell represents a potential location where a node can be placed.Node Assignment: Nodes, which are the primary elements within a layout, can be allocated to a specific cell within the grid. The class allows for a node to occupy a single cell or span across multiple consecutive cells. Once a node is assigned to its designated cell or cells, it remains fixed in that position throughout the layout process.
Geometric Data Storage: Beyond the structural aspects, the
PartitionGridclass also maintains critical geometric information about the grid’s rows and columns. This includes details such as the minimum heights and widths required for each row and column, ensuring that the grid can accommodate the nodes’ dimensions. Additionally, the class accounts for insets, which are the margins or padding within the cells, providing clearance around the nodes and contributing to the overall aesthetics and readability of the layout.
The PartitionGrid class is essential for users who need to organize nodes in a clear, grid-based pattern while retaining the flexibility to define the size and spacing of the grid elements. Whether it’s for simple tabular data representation or complex swimlane diagrams that depict processes and workflows, the PartitionGrid class offers a foundational structure that can be tailored to various layout needs.
Features
When utilizing the FIXED_SIZE policy, it’s possible to specify the exact location within a table where a node will be positioned. For comprehensive information on this policy, you should refer to the associated policy documentation.
The algorithm in question takes into account several properties tied to the RowDescriptors and ColumnDescriptors of a PartitionGrid that’s been associated with the input graph. These properties include:
- topInset: The space allocated above the row.
- bottomInset: The space allocated below the row.
- minimumHeight: The least possible height of the row.
- leftInset: The space allocated to the left of the column.
- rightInset: The space allocated to the right of the column.
- minimumWidth: The least possible width of the column.
Support for group nodes is integrated into the system, but it’s important to note that only top-level groups are treated as individual nodes within the table layout. The internal content of these top-level groups remains static, meaning that while the content maintains its relative position within the top-level group, it does not undergo a recursive tabular arrangement.
To implement recursive layouts where the content itself is organized in a tabular manner, one should employ the RecursiveGroupLayout with TabularLayout as the core layout algorithm. It’s generally advisable for group nodes to have pre-defined bounds that encompass all their content, including labels. This precaution helps to prevent any potential overlapping, as the dimensions of group nodes are not altered by this algorithm.
In scenarios where you wish to recursively determine the sizes of group nodes, the RecursiveGroupLayout with NULL_LAYOUT as the core algorithm serves as an effective tool. This approach allows for the recursive assignment of dimensions to group nodes, ensuring a cohesive and non-overlapping layout. ### Layout
In a tabular layout, the table is designed as a matrix composed of cells arranged in rows and columns. Each individual cell is designated to hold a single node, which represents a unit of data or information. Alternatively, a cell may be left vacant, signifying the absence of a node.
It’s important to understand that the presence of a PartitionGrid within the input graph is not a prerequisite for the algorithm to function effectively. A PartitionGrid is a framework that divides the graph into distinct partitions, which can be beneficial for certain operations. For instance, if one desires to extract the geometric configuration of rows and columns post-algorithm execution—perhaps for the purpose of rendering a visual representation of the table—a PartitionGrid can be quite advantageous. However, when employing a layout policy labeled as FIXED_SIZE, the integration of a PartitionGrid becomes essential.
The architecture of the rows and columns adheres to a strict non-overlapping and non-compacting principle. This means that nodes allocated to separate rows are unequivocally demarcated by distinct ranges of y-coordinates, ensuring vertical segregation. Similarly, nodes assigned to disparate columns are clearly delineated by exclusive ranges of x-coordinates, guaranteeing horizontal separation. This meticulous arrangement ensures that each node occupies its own unique space within the table, without any intersection or compression between rows and columns. Such an organized layout facilitates clarity and precision in the representation of data within the table structure. ### Business Domains
Tabular layouts are essential tools in various business sectors, providing a clear and concise way to display data for easy comprehension and analysis. Here’s an expanded look at how they are employed across different domains:
Finance: Financial experts rely on tabular layouts to present complex financial data in an accessible manner. They are indispensable for creating detailed financial statements, such as balance sheets and income statements, which provide insights into a company’s financial health. Budgeting tables allow for the allocation and tracking of financial resources, ensuring that spending aligns with strategic goals. Economic analysis also benefits from tabular layouts, as they help in visualizing economic trends and comparisons, making it easier to interpret economic indicators and forecasts.
Sales and Marketing: In the dynamic fields of sales and marketing, tabular layouts serve as a foundation for tracking a multitude of metrics. Sales teams use tables to monitor sales figures, customer acquisition costs, and revenue growth. Marketing professionals depend on tables to analyze campaign performance, track engagement metrics, and organize customer segmentation data. This structured approach enables teams to identify trends, measure ROI, and strategize future campaigns effectively.
Human Resources: Human Resources departments utilize tabular layouts to manage employee-related data efficiently. These tables are crucial for maintaining comprehensive employee records, including personal details, job roles, and employment history. Payroll tables are used to calculate salaries, taxes, and benefits, ensuring accurate and timely compensation. Performance evaluation tables help in assessing employee performance, setting objectives, and planning career development paths.
Supply Chain Management: Tabular layouts are vital in supply chain management for overseeing the flow of goods and services. Inventory tables help in tracking stock levels, turnover rates, and reorder points, which are critical for maintaining optimal inventory levels. Shipping logistics tables provide a snapshot of shipping schedules, delivery statuses, and transportation costs. Supplier data tables offer a centralized view of supplier performance, contract details, and procurement metrics.
Healthcare: The healthcare industry relies on tabular layouts to manage patient information systematically. Patient records tables contain vital health data, medical history, and treatment plans. Treatment schedules are organized in tables to ensure timely administration of medications and therapies. Billing tables are used to itemize medical services, process insurance claims, and manage patient payments.
Real Estate: Real estate professionals use tabular layouts to catalog properties and manage transactions. Property listings tables include details like location, size, amenities, and pricing. Pricing tables help in comparing market values and determining competitive selling prices. Transaction records tables track the stages of property sales, from initial offers to closing deals.
Education: Educational institutions employ tabular layouts to organize vast amounts of student-related data. Student information tables store personal details, enrollment status, and emergency contacts. Grades tables record academic performance, providing a basis for evaluations and progress tracking. Course schedules are laid out in tables to manage class timings, room assignments, and instructor allocations.
Information Technology: In the realm of information technology, tabular layouts are crucial for managing technical data. Database management tables help in organizing data elements, relationships, and schema designs. System configurations are documented in tables to detail hardware and software settings. IT asset tracking tables maintain records of technology assets, licenses, and maintenance schedules.
Retail: The retail sector utilizes tabular layouts to oversee product and sales information. Product catalogs are organized in tables to display item descriptions, pricing, and stock levels. Sales reports tables summarize transaction data, revenue, and customer buying patterns. Customer demographics tables help in understanding the target market by analyzing age, gender, and purchasing habits.
Manufacturing: In manufacturing, tabular layouts are key to monitoring production processes. Production schedules are outlined in tables to plan and track manufacturing runs, ensuring efficiency and timeliness. Quality control tables are used to document inspection results, defect rates, and compliance with standards. Machinery maintenance tables schedule regular upkeep and repairs, minimizing downtime and extending equipment life.
Playgrounds
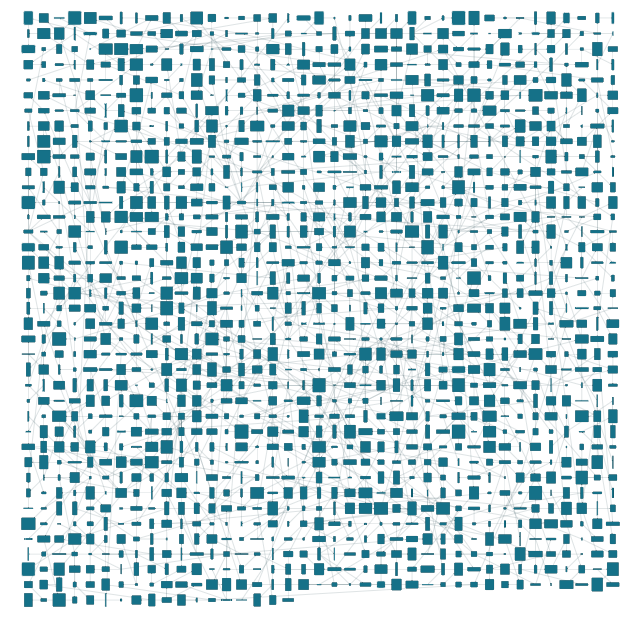
const nodeCount = 1500
const rootNode = graph.createNode()
const nodes: INode[] = [rootNode]
for (let i = 1; i < nodeCount; i++) {
  const n = graph.createNode();
  graph.setNodeLayout(n, new Rect(0,0,10+Math.random()*150, 10+Math.random()*150));
  nodes.push(n)
  graph.createEdge(nodes[Math.floor(Math.random() * (i - 1))], nodes[i])
}


const layout = new TabularLayout();
// this allows you to customize the underlying grid
const grid = new PartitionGrid(10,10,10,10)
const layoutData = new TabularLayoutData({
      // nodeLayoutDescriptors: nodeLayoutDescriptor,
      partitionGridData: new PartitionGridData({ grid })
    })
layout.considerEdges = true
await graphComponent.morphLayout(layout, '2s', layoutData)