Radial Layout
Overview
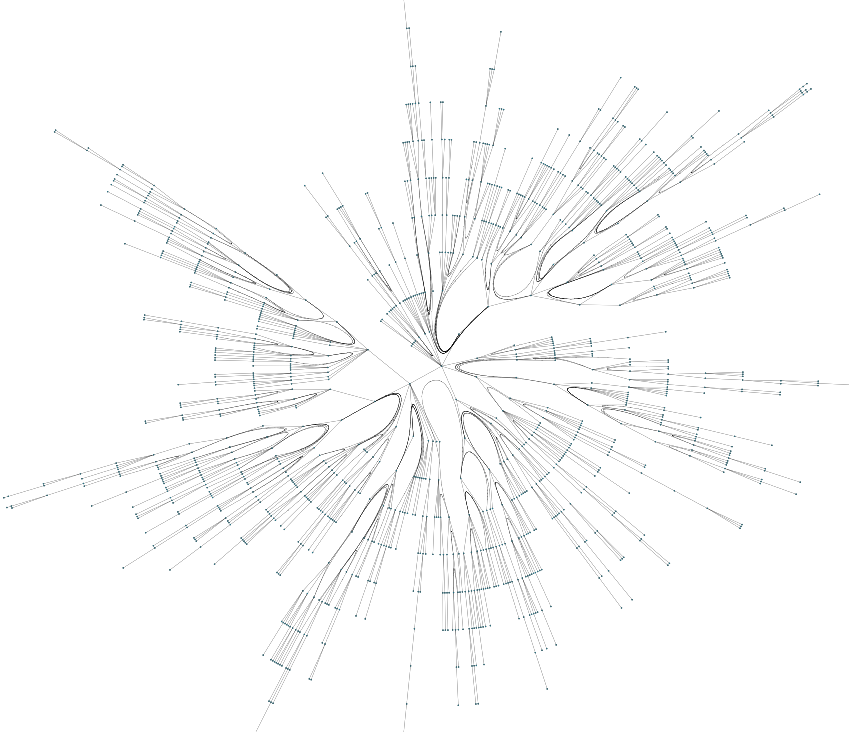
The Radial Layout is a compelling visualization technique that organizes the nodes of a graph into multiple concentric circles, which are often referred to as layers. This method is particularly effective for displaying data that has inherent hierarchical structures or resembles a tree, with branches stemming from a central node. The layout’s design naturally draws the viewer’s attention to the relationships between nodes, as it places related nodes on the same layer or on adjacent layers, allowing for an intuitive understanding of the graph’s structure.
In a radial layout, the central node, typically representing the root of the tree or the highest-level parent in a hierarchy, is placed at the center of the layout. From this point, nodes are arranged on concentric circles based on their level in the hierarchy. The proximity of nodes to the center often indicates their centrality or importance within the network. Nodes with higher centrality, which might be those with more connections or those that are more influential in the flow of information or resources, are positioned closer to the center. This central positioning highlights their significance and makes them more visually prominent.
This layout style excels in visualizing directed graphs, where the direction of the edges indicates a flow from one node to another, such as organizational charts, family trees, or decision trees. It’s particularly useful when the graph has a clear start point and an end point, with the paths between nodes representing processes, sequences, or dependencies.
Moreover, the radial layout can be an excellent choice for visualizing networks where centrality is a key concept. For instance, in social network analysis, nodes representing individuals with higher centrality might be those with more social connections or greater influence. By placing these nodes closer to the center, the radial layout can effectively communicate the structure of social influence within the network.
The radial layout also offers aesthetic advantages. It can create visually appealing diagrams that are not only informative but also engaging to the viewer. The circular arrangement can be easier to read and understand compared to more traditional linear layouts, especially when dealing with complex structures.
It is a versatile and effective tool for graph visualization that emphasizes hierarchical relationships and centrality. Well-suited for directed graphs and structures with clear directional flow, and it provides both functional and aesthetic benefits for representing complex data in a clear and understandable manner.
If you’re working on a project that involves graph visualization, the Radial Layout could be a powerful tool to represent your data clearly and effectively. Would you like to know more about how to implement this layout or about other graph layout strategies?
Features
In the Radial Layout, various policies can be implemented to determine the central nodes. These policies dictate whether a single node will occupy the center of the layout or if multiple nodes will be arranged on the innermost circle. The selection of these central nodes is crucial as it influences the overall structure and readability of the graph.
Once the central nodes are determined, the remaining nodes are distributed across the concentric circles according to a predefined layering strategy. This strategy specifies how nodes are assigned to each layer, typically based on their hierarchical level or other relevant criteria.
The connections between nodes, known as edges, are then routed following an edge routing strategy. This strategy aims to minimize overlaps between edges and nodes, although it’s important to note that complete avoidance of overlaps is not always possible due to the complexity of the graph’s structure.
To maintain clarity and prevent clutter, a minimum distance, denoted as minimumNodeToNodeDistance, is established between nodes that share the same circle. Should a circle become overcrowded with nodes, its radius is incrementally enlarged until there is sufficient space for all nodes to fit without overlapping.
The spacing between each concentric layer is defined by the layerSpacing parameter. The radii of the circles are calculated as multiples of this spacing value. In scenarios where layerSpacing is set to 0, the algorithm automatically adjusts the radii to ensure that all nodes are accommodated on their respective circles. Additionally, a minimumLayerDistance parameter sets a baseline for the distance between layers to further enhance readability.
The RadialLayout also incorporates node types as a secondary sorting criterion within the same circle. The algorithm is designed to place nodes of identical types adjacent to each other, provided that doing so does not result in additional edge crossings or violate other layout constraints. While an optimization heuristic is employed to improve node placement concerning types, it does not guarantee an optimal arrangement and may extend the overall runtime. It’s worth noting that this optimization does not alter the initial layer assignments.
For tree-like graphs, the RadialLayout offers a feature to order the successor nodes of a local root node that reside on the same circle. This ordering is achieved through an IComparer<T> associated with the local root node, identified by the OUT_EDGE_COMPARER_DP_KEY. This ordering mechanism takes precedence over node types and is particularly useful for sorting child nodes in a manner that reflects their relationships and hierarchy within the graph.
Layout
Virtual Tree Structure: The algorithm begins by creating a virtual tree structure from the input graph. This tree structure is essential for determining the hierarchical relationships between nodes.
Root Node Placement: The root node of this virtual tree is placed at the center of the layout. This central placement allows for an even distribution of nodes around it.
Layered Placement of Children:
- Each child node is placed on a higher layer than its parent node.
- Layers are represented by circles with increasing radii, moving outward from the root.
- The idea is to place children nodes on the circumference of a circle whose radius is greater than the circle on which the parent node lies.
Sector Calculation:
- A sector of a circle is allocated to each node.
- The sector’s angle is calculated to ensure that it can contain the entire subtree of that node.
- Child nodes are assigned sub-sectors within their parent’s sector, maintaining the hierarchical structure.
Radius Calculation:
- The radii of the circles are determined based on the size of the sectors needed to accommodate the subtrees.
- Larger subtrees will require larger sectors and, consequently, larger radii to fit all child nodes without overlap.
Subtree Accommodation:
- The layout ensures that each subtree fits within its designated sector on the appropriate circle.
- This prevents overlap between nodes and keeps the tree structure visually clear and readable.
Business Domains
The radial layout, a powerful tool for visualizing intricate relationships and hierarchies, is extensively utilized across various business sectors to enhance understanding and communication.
Enterprise Architecture: Within the realm of enterprise architecture, radial layouts serve as a strategic visual aid. They illuminate the intricate web of interconnections among diverse business domains, delineating the capabilities within each domain. Moreover, they elucidate how these domains are interlinked with corresponding solution capabilities, thereby fostering a comprehensive understanding of the enterprise’s structural and functional aspects.
Data Governance: In the sphere of data governance, radial layouts are instrumental, particularly within frameworks such as Microsoft Purview. They graphically demarcate the boundaries of distinct business domains, encompassing critical operational areas like human resources, sales, finance, and supply chain management. This visualization aids stakeholders in grasping the scope and scale of data governance across the organization.
Business Analysis: Business analysts leverage radial layouts to dissect business domains into their fundamental components. This methodical breakdown simplifies complex structures, rendering service areas and company activities more accessible and comprehensible. It’s a valuable technique for analyzing and communicating the core functions of a business.
Information Technology: IT departments adopt radial layouts to meticulously chart out the organization’s infrastructure, network designs, and system dependencies. This visual representation is crucial for managing IT resources effectively, planning upgrades, and ensuring seamless operation of the technological backbone of the company.
Project Management: Project managers employ radial layouts to monitor and display the interdependencies and progression of various project elements. This visual tool is particularly useful for tracking milestones, assessing project health, and communicating status updates to stakeholders.
Marketing and Sales: Marketing and sales teams utilize radial layouts to map customer segments, conduct market analysis, and formulate sales strategies. These layouts provide a bird’s-eye view of the market landscape, enabling teams to identify opportunities and tailor their approaches to different customer demographics.
Strategic Planning: For strategic planning purposes, organizations turn to radial layouts to articulate the connections between various strategic initiatives and the anticipated business outcomes. This helps in aligning the organization’s goals with actionable plans and measuring the impact of strategic decisions.
In essence, radial layouts are a versatile and effective tool for visualizing complex systems and relationships, aiding decision-makers across various business domains in navigating and managing their respective areas with greater clarity and insight.
Technical Details
Center Node(s)
The radial layouts stands out from other layout algorithms with its focus on a particular node or a set of nodes. You can set one or more nodes in the center via the RadialLayoutData:
const centerNode = graph.nodes.get(0); // for example
const layoutData = new RadialLayoutData({
    centerNodes:[centerNode] // one or more
  })
  await graphComponent.morphLayout(layout, '1s', layoutData)
Radius
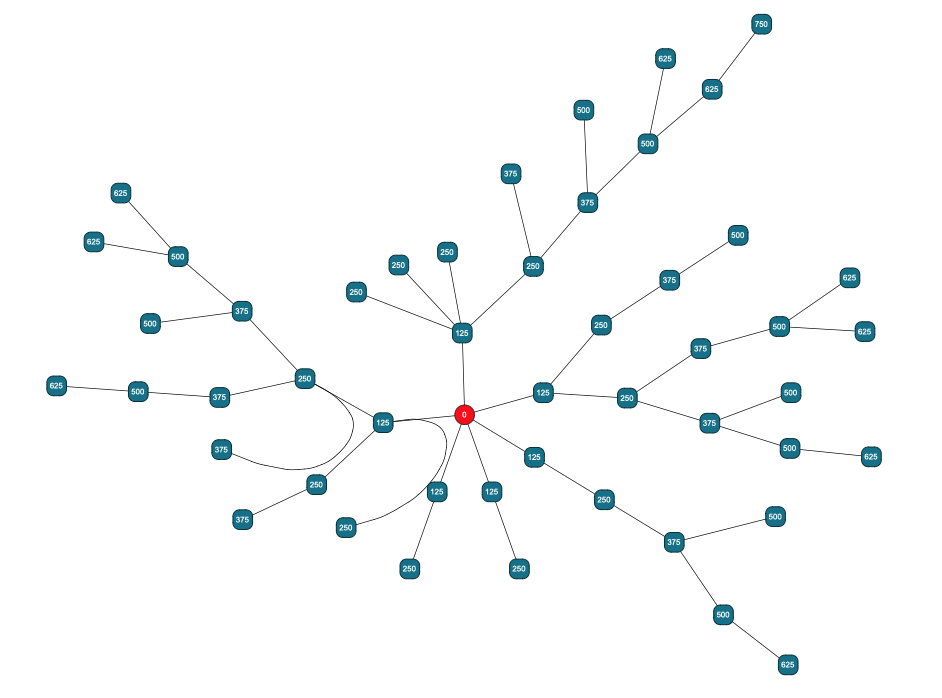
Things like the sector, radius of the layer and other information is not accessible by default and you need to tell the layout to populate this data via a mapper. A concrete example of how to obtain the radius of the layer is shown in the playground below. The generic approach is to create a mapper before layout:
graph.mapperRegistry.createMapper(RadialLayout.NODE_INFO_DP_KEY);and fetch the data after layout via the complementary
 const circleInfo = graph.mapperRegistry.getMapper(RadialLayout.NODE_INFO_DP_KEY);
  graph.nodes.forEach(node => {
        const info = circleInfo.get(node);
        graph.addLabel(node, info.radius.toString())
  })
The circleIndex and other info is also available, see the RadialLayoutNodeInfo documentation for details.
Edge Bundling
Bundling edges is a great way to decrease visual noise and emphasize the aspect of ‘flow’ in a graph at the same time. You can enable bundling across all edges via
const layout = new RadialLayout();
layout.edgeBundling.defaultBundleDescriptor = new EdgeBundleDescriptor({
    bundled: true
  })
If you want to bundle only some edges this is possible as well. In this case you need to make use of the EDGE_BUNDLE_DESCRIPTOR_DP_KEY.
Playgrounds
// ============================================================
// Basic radial layout with edge bundling
// ============================================================

graph.edgeDefaults.style= new PolylineEdgeStyle({smoothingLength:20})
const nodeCount = 1200
for (let i = 0; i < nodeCount; i++) {
  graph.createNode( )
}
const nodes = graph.nodes.toArray()
for (let i = 1; i < nodes.length; i++) {
  graph.createEdge(nodes[Math.floor(Math.random() * (i - 1))], nodes[i])
}

const layout = new RadialLayout();
layout.edgeBundling.defaultBundleDescriptor = new EdgeBundleDescriptor({
    bundled: true
  })
await graphComponent.morphLayout(layout, '1s')
``
▸ radial layout radius and using the NODE_INFO_DP_KEY key
//============================================================
// This playground shows how to use the RadialLayout.NODE_INFO_DP_KEY
// to fetch post-layout info for each node.
// We show with a node label the distance to the center.
//============================================================

let nodes;

function createGraph(){
  graph.edgeDefaults.style= new PolylineEdgeStyle({smoothingLength:20})
  graph.nodeDefaults.labels.style = new DefaultLabelStyle({backgroundFill:"transparent", textFill: "white"})
  const nodeCount = 50
  for (let i = 0; i < nodeCount; i++) {
    graph.createNode({tag:i} )
  }

  nodes = graph.nodes.toArray()
  for (let i = 1; i < nodes.length; i++) {
    graph.createEdge(nodes[Math.floor(Math.random() * (i - 1))], nodes[i])
  }
}
async function layout(){
  graph.mapperRegistry.createMapper(RadialLayout.NODE_INFO_DP_KEY);
  const layout = new RadialLayout();
  layout.edgeBundling.defaultBundleDescriptor = new EdgeBundleDescriptor({
      bundled: true
    })
  const c = nodes[0]
  const red = new ShapeNodeStyle({fill:"red", shape:"ellipse"});
  graph.setStyle(c,red)
  const layoutData = new RadialLayoutData({
    centerNodes:[c]
  })
  await graphComponent.morphLayout(layout, '1s', layoutData)
}

function radiusLabel(){
  const circleInfo = graph.mapperRegistry.getMapper(RadialLayout.NODE_INFO_DP_KEY);
  graph.nodes.forEach(node => {
          const info = circleInfo.get(node);
          if (info) {
            // console.log(info.radius)
            graph.addLabel(node, info.radius.toString())
            // console.log(node.tag)
            // return true;
          }
  })

}

createGraph()
layout().then(()=>{radiusLabel()})