from neo4j.graph import Relationship, Node
from neo4j import GraphDatabase, Result

import pandas as pd
import networkx as nx


def to_nx(data: Result):
    """
    Converts a Neo4j graph to a NetworkX graph.

    Example:

        from neo4j import GraphDatabase
        driver = GraphDatabase.driver('bolt://localhost:7687', auth=("neo4j", "123"))
        query = `MATCH (p:User)-[r:WATCHED]->(m:Movie) RETURN *`
        with driver.session() as session:
            result = session.run(query)
            G = to_nx(result)
    """

    G = nx.MultiDiGraph()

    def add_node(node):
        # Adds node id it hasn't already been added
        id = node.element_id
        if G.has_node(id):
            return
        G.add_node(id, labels=list(node._labels), properties=dict(node))

    def add_edge(relation):
        # Adds edge if it hasn't already been added.
        # Make sure the nodes at both ends are created
        for node in (relation.start_node, relation.end_node):
            add_node(node)
        # Check if edge already exists
        u = relation.start_node.element_id
        v = relation.end_node.element_id
        eid = relation.element_id
        if G.has_edge(u, v, key=eid):
            return
        G.add_edge(u, v, key=eid, type_=relation.type, properties=dict(relation))

    recs = [r for r in data]
    for d in recs:
        for entry in d.values():
            if isinstance(entry, Node):
                add_node(entry)
            elif isinstance(entry, Relationship):
                add_edge(entry)
            else:
                raise TypeError("Graph item is neither node nor relationship.")
    return G
Neo4j to NetworkX
Neo4j
Code
How to convert Cypher results to a NX graph.
Though Neo4j scales well and has good support for graph analytics, it’s also often easier to do things in NetworkX. It’s also easier to experiment with algorithms in NetworkX. NetworkX can handle quite a bit of data (millions of nodes and edges) and is quite fast. If you need more power you can also take a look at GraphScope, which is a distributed graph processing system built on top of NetworkX.
If you need some Neo4j data, you can download for instance the entity resolution dataset.
![]()
This simple function can be used like so:
driver = GraphDatabase.driver('bolt://localhost:7687', auth=("neo4j", "123456789"))

query = """
MATCH (p:User)-[r:WATCHED]->(m:Movie)
RETURN *
"""

with driver.session() as session:
    result = session.run(query)
    G = to_nx(result)

print(G)
MultiDiGraph with 742 nodes and 999 edgesIf we go full scale and fetch the whole database:
driver = GraphDatabase.driver('bolt://localhost:7687', auth=("neo4j", "123456789"))

query = """
MATCH (u)-[r]->(v)
RETURN *
"""

with driver.session() as session:
    result = session.run(query)
    G = to_nx(result)
    print(G)
MultiDiGraph with 1237 nodes and 1819 edgesThis is not necessarily the whole graph and if you really wish to include the singletons this can easily be added. Typically (e.g. entity resolution and fraud) singletons are of no interest in graph analytics.
We can export this NetworkX graph in various formats for downstream usage:
import networkx as nx

nx.write_gml(G, "./EntityResolution.gml")
nx.write_edgelist(G,"./EntityResolution.edgelist")

import pickle
with open('./EntityResolution.pkl', 'wb') as f:
    pickle.dump(G, f, pickle.HIGHEST_PROTOCOL)
The GML format is useful for graph visualization while the edgelist is a good format for NetworkX. You can use yEd or yEd Live to generate a beautiful rendering of the graph: 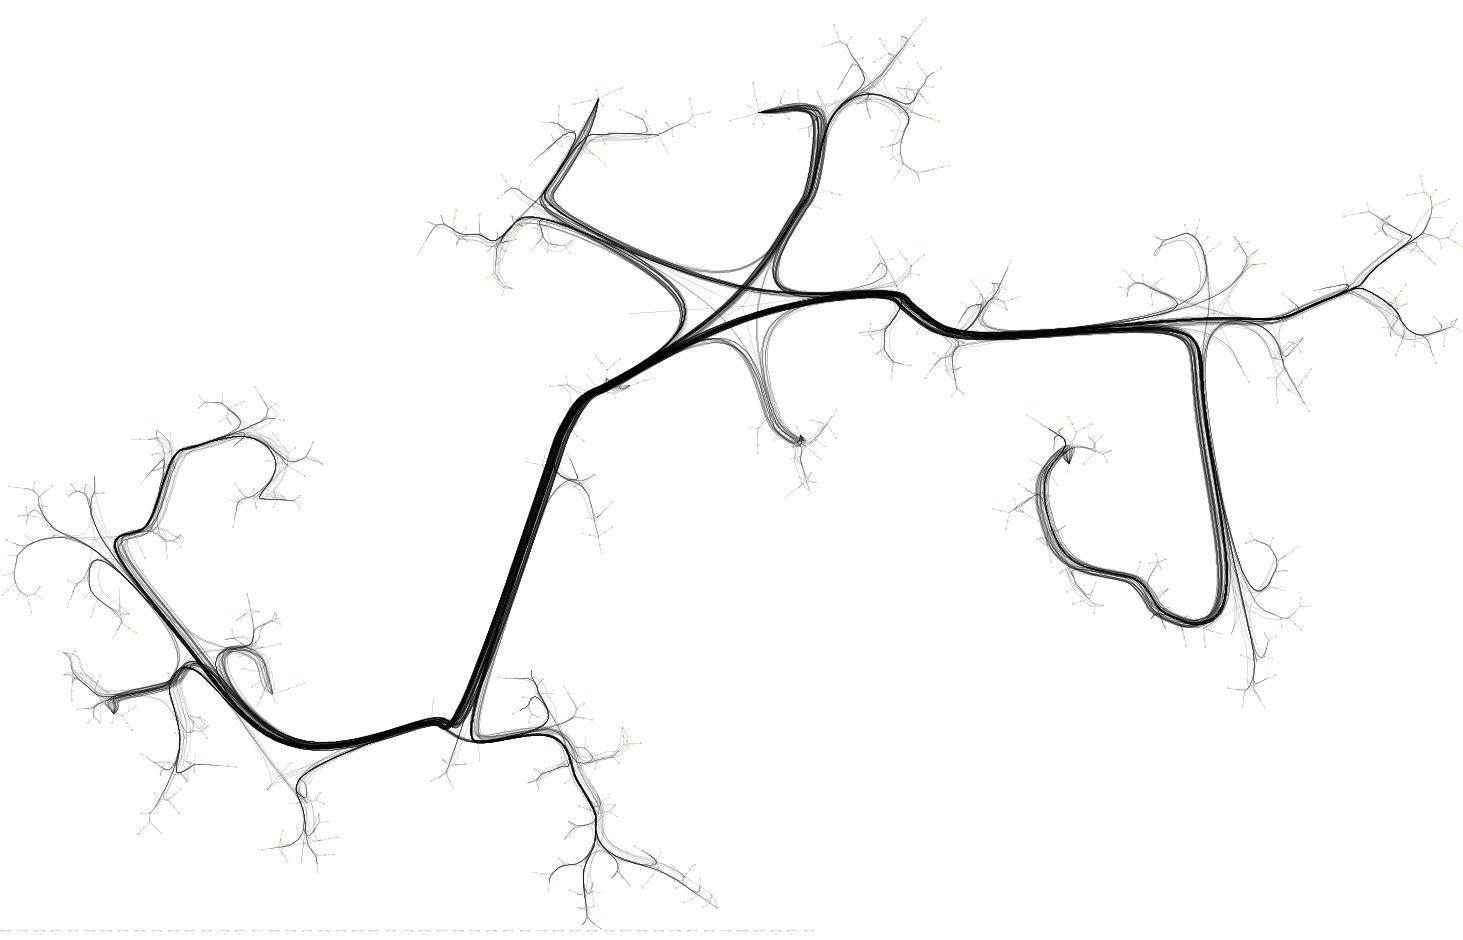
You can use this link to see it directly in yEd Live.
This visualization says nothing about entity resolution and you can find out more about this in our Graph Analytics section. The edgelist fornmat does not, as the name says, save payloads. That is, the data attached to nodes and edges is not serialized, only the adjacency structure. The safest way to store a NetworkX with data and all is to use the Python pickle. Note that the various export formats do not necessarily work with directed graphs or with attached data. To load the saved graph back into NetworkX you can use
with open('./EntityResolution.pkl', 'rb') as f:
    G = pickle.load(f)
print(G)
MultiDiGraph with 1237 nodes and 1819 edgesTo access the nodes and their properties you can use something like:
for id in G.nodes():
    n = G.nodes[id]
    print(id)
    print(n["labels"])
    print(n["properties"])
    break
4:ef918487-388f-49e7-8961-7d1b1962ff38:0
['User']
{'lastName': 'Burbidge', 'country': 'US', 'firstName': 'Dorette', 'gender': 'Male', 'phone': '834-424-8856', 'state': 'Ohio', 'userId': 1, 'email': 'dburbidge0@japanpost.jp'}You can download the pickle here if you wish to use it directly in you code.