Network Art
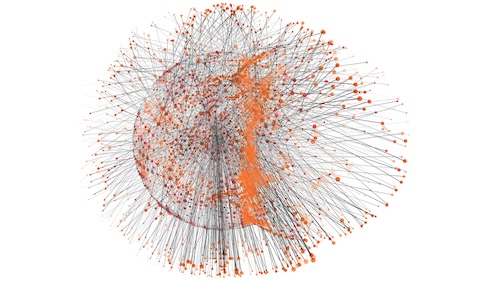
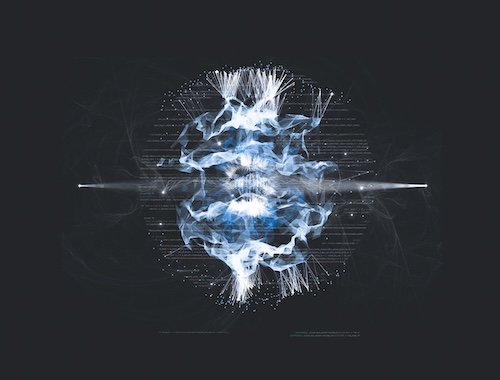
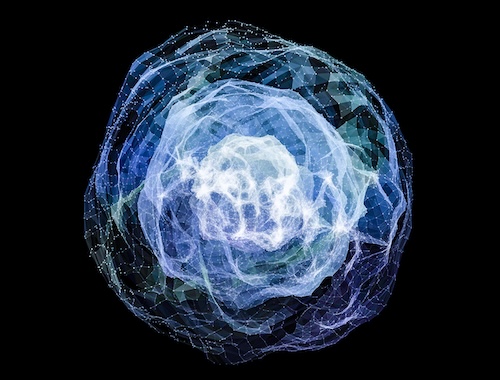
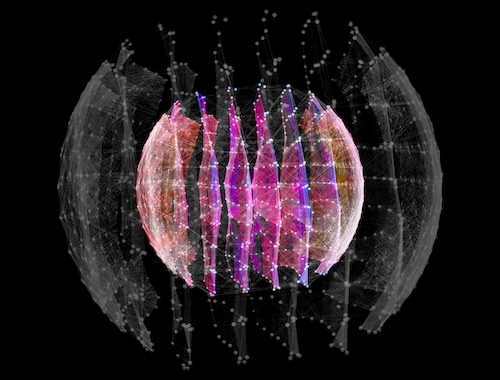
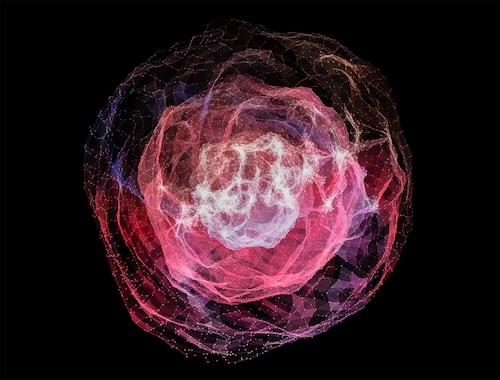
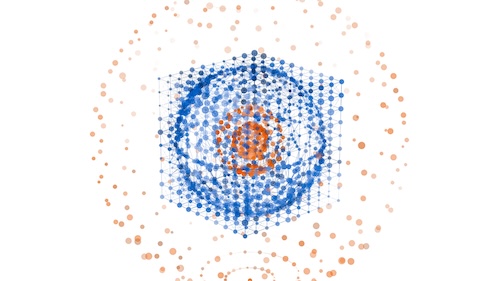
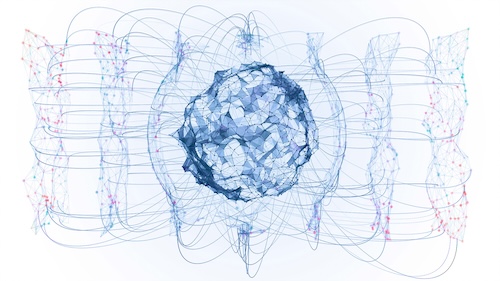
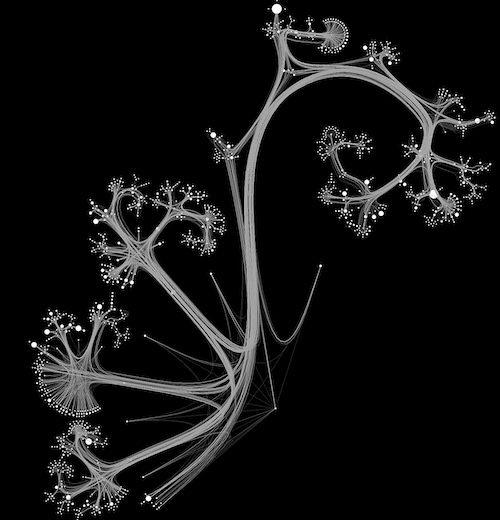
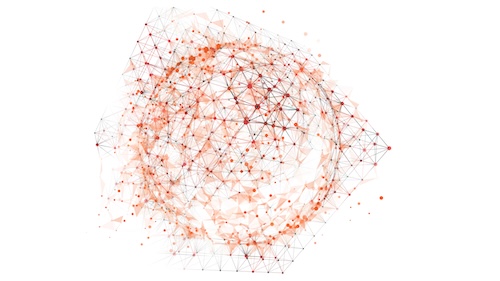
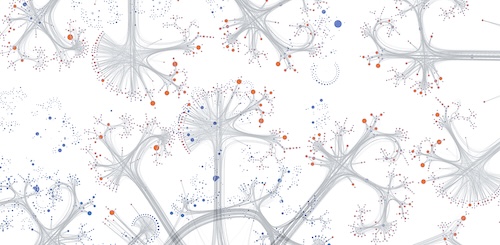
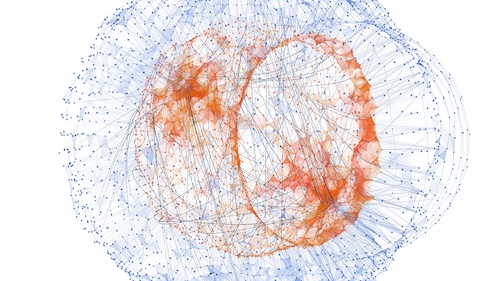
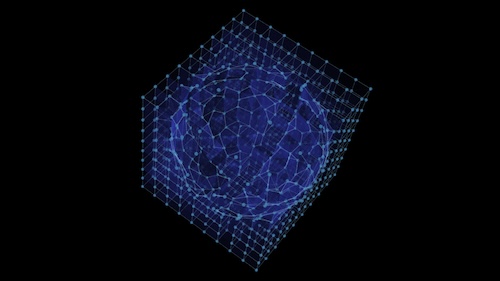
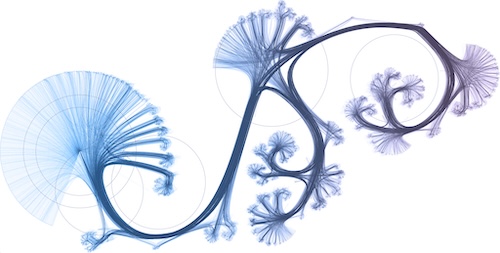
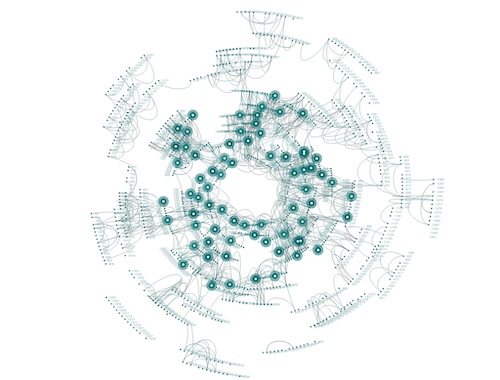
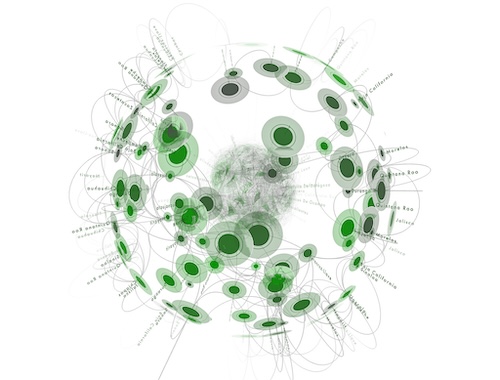
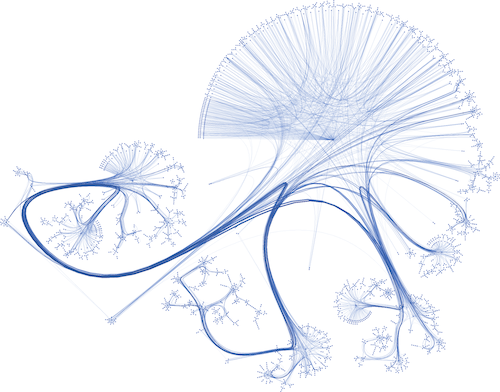
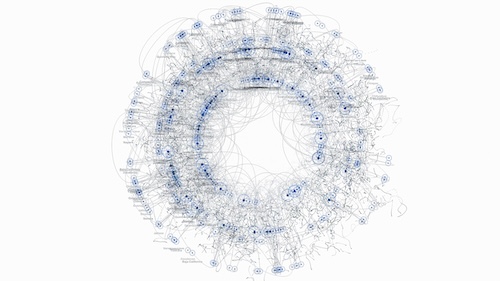
It takes a touch of art to create beautiful network visualizations, and data visualizations in general. Combining the different dimensions (colors, business context, shapes, layout…) to convey insights requires experience and intuition. If one drops the business context you easily end up creating good looking things without a particular meaning. Simply combining features of a graph visualization framework and pseudo-random data leads to, what I call, network art.
There are, in addition, various tools out there which help create inspiring visualizations: After Effects, Photoshop, Blender, Cinema 4D and more. Theses visualizations are maybe not directly useful in a business project but they help to convey a vision, a brand or part of a mockup.
Over the years book authors, researchers and others have picked up (sometimes politely asking for permission) some of Orbifold’s renderings. Most of the network art I create are actually easily reproduced, provided you have access to the tools and enjoy experimenting with possibilities.
In this section you will find a collection of network art (and tangents) created in the past 25 years. Most of the images were created for graphics in web pages and tweets.
If you need some particular format, size or image, drop me a line.
