Cactus Layout
Overview
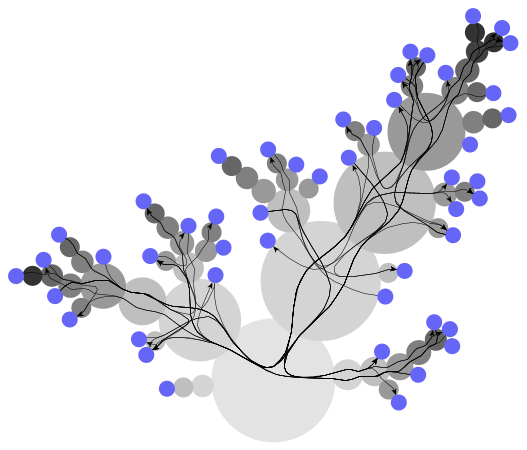
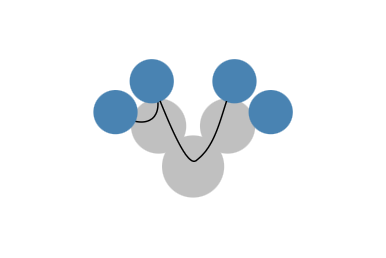
The CactusGroupLayout is a unique design that organizes both directed and undirected graphs that are grouped hierarchically. It positions all group members next to the group node on its circular boundary, creating a cactus-like structure. The graph’s group hierarchy is implicitly represented by the nodes’ positions. Edges that are not part of the hierarchy are directed through the centers of all nodes along a path in the hierarchy tree, linking the edge’s endpoints.
These cactus group layout algorithms are frequently employed to visualize relational data and generate high-quality diagrams that highlight the graph’s hierarchical features. They are particularly effective in addressing the issue of distinguishing between identical subtrees.
The visualization is designed to be visually appealing and engaging, compatible with any graph structure. It shines when used with hierarchies or trees with a limited number of non-tree edges. One of the standout features of this visualization is its emphasis on flow, which significantly improves the user’s experience and comprehension of the data.
Features
The CactusGroupLayout algorithm is a powerful tool for visualizing hierarchical data structures. Here are some of its key features and capabilities:
Hierarchy Collapsing: The algorithm provides the ability to collapse the hierarchy at one or more of its groups. This allows all direct and indirect members of the specified group or groups to be gathered along their boundary. The collapsed groups can be specified using the
IDataProviderregistered with theCOLLAPSED_SUBTREE_ROOTS_DP_KEY.Integrated Node Labeling: The CactusGroupLayout supports integrated node labeling. Node labels are automatically placed without generating overlaps with other labels or graph elements. However, it’s important to note that for nodes with multiple labels, such overlaps may occur. There are different strategies available for placing node labels.
Edge Bundling Support: The algorithm supports edge bundling and all its included features for non-hierarchical edges of the graph. This enhances the visual clarity of the graph, especially when dealing with complex data structures.
Preferred Wedge Angle: Defining a preferred wedge angle greatly influences the layout style. Subtrees at the hierarchy’s root are given a certain amount of radial space to be placed around the root node. A large preferred angle generally leads to more compact drawings, while a smaller angle focuses the drawing towards a singular direction.
Customizable Node Overlap: The CactusGroupLayout allows for customizing the overlap between nodes and their parent nodes. The overlap can be set individually for each node by registering an
IDataProviderwith thePARENT_OVERLAP_RATIO_DP_KEY.Performance: Since it is not computationally complex, the CactusGroupLayout is well suited for large graphs. It performs well even for huge graphs, making it a versatile tool for various data sizes.
Label Overlapping: Even though the integrated node labeling is enabled, there may sometimes be overlapping labels if there are nodes with multiple labels. This is a consideration to keep in mind when working with nodes that have multiple labels.
Node Style Recommendation: The layout algorithm considers the nodes as circles. Therefore, using a circular node style is strongly recommended to obtain suitable visualizations. This ensures that the visual output aligns with the underlying data structure. ### Layout
The algorithm follows a systematic process to achieve its objectives. Here are the steps it takes in a more detailed format:
Creation of a Virtual Root: If there isn’t a single group that serves as a unique root of the hierarchy, the algorithm creates a virtual root. This root contains all nodes and forms the basis for the layout. This step ensures that there is a central point from which the layout can be structured.
Size Determination and Subtree Placement: The algorithm then determines the size of each node recursively. This size is calculated to accommodate the subtrees rooted in its children. The subtrees are then placed relative to the node. A key aspect of this step is the prioritization of large subtrees. These are placed in centered positions to encourage vertical growth. This approach helps to maintain balance and symmetry in the layout.
Subtree Placement Adjustment: The next step involves adjusting the placement of individual subtrees. This is done to optimize the usage of space around the subtree roots and improve the compactness of the drawing. By making these adjustments, the algorithm ensures that the layout is as efficient and space-saving as possible.
Routing of Non-Hierarchical Edges: The algorithm then routes the non-hierarchical edges of the graph. This is done according to the specified routing policies. This step ensures that the edges are placed in a way that aligns with the overall structure and design of the graph.
Removal of the Virtual Root: If a virtual root was added during the first step of the algorithm, it is removed in this final step. This ensures that the layout remains true to the original data structure, without any additional elements.
By following these steps, the algorithm is able to create a clear, balanced, and efficient layout for visualizing hierarchical data structures.
Business Domains
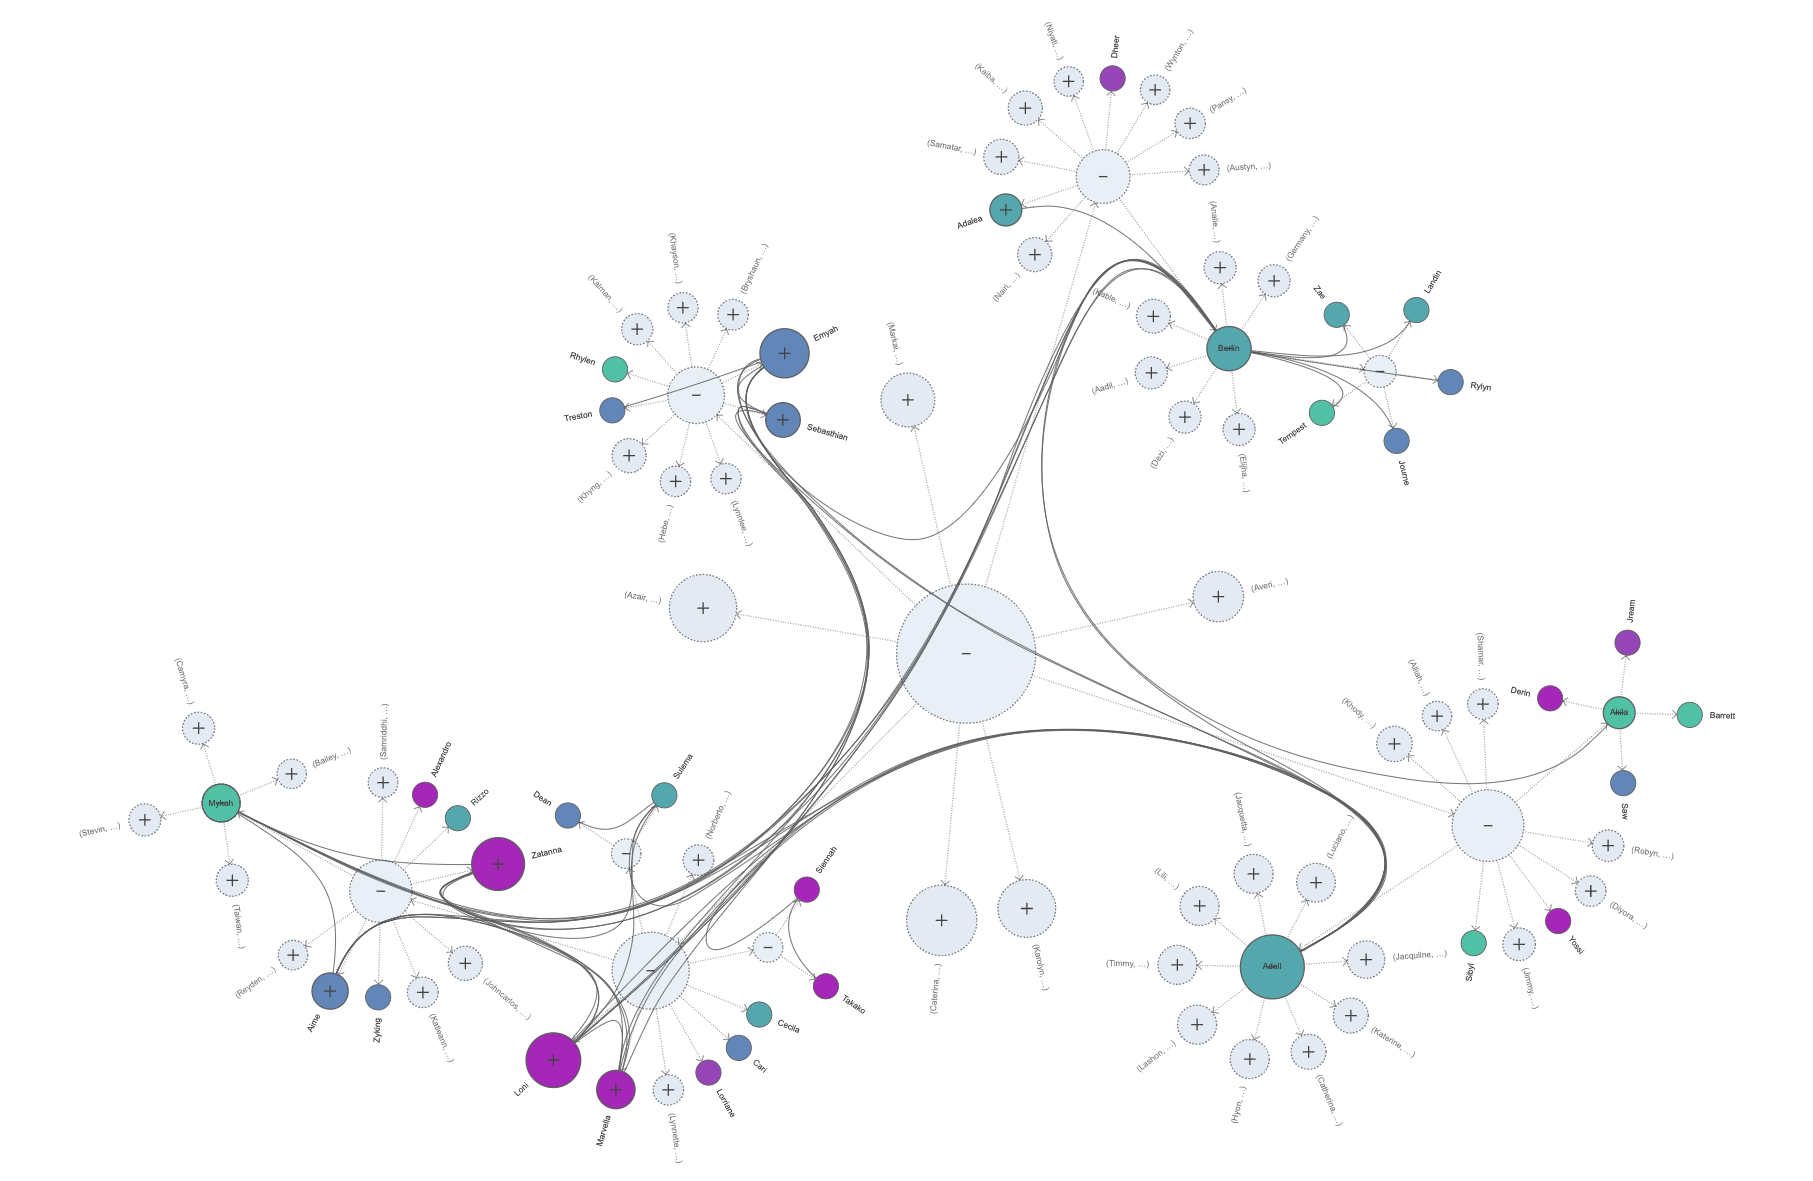
Business management and hierarchies play a crucial role in organizations and operation of companies. They provide a structured approach to decision-making, resource allocation, and communication. A cactus layout of such hierarchies establishes a clear overview especially if combined with expand/collapse allowing for drill-downs and focus.
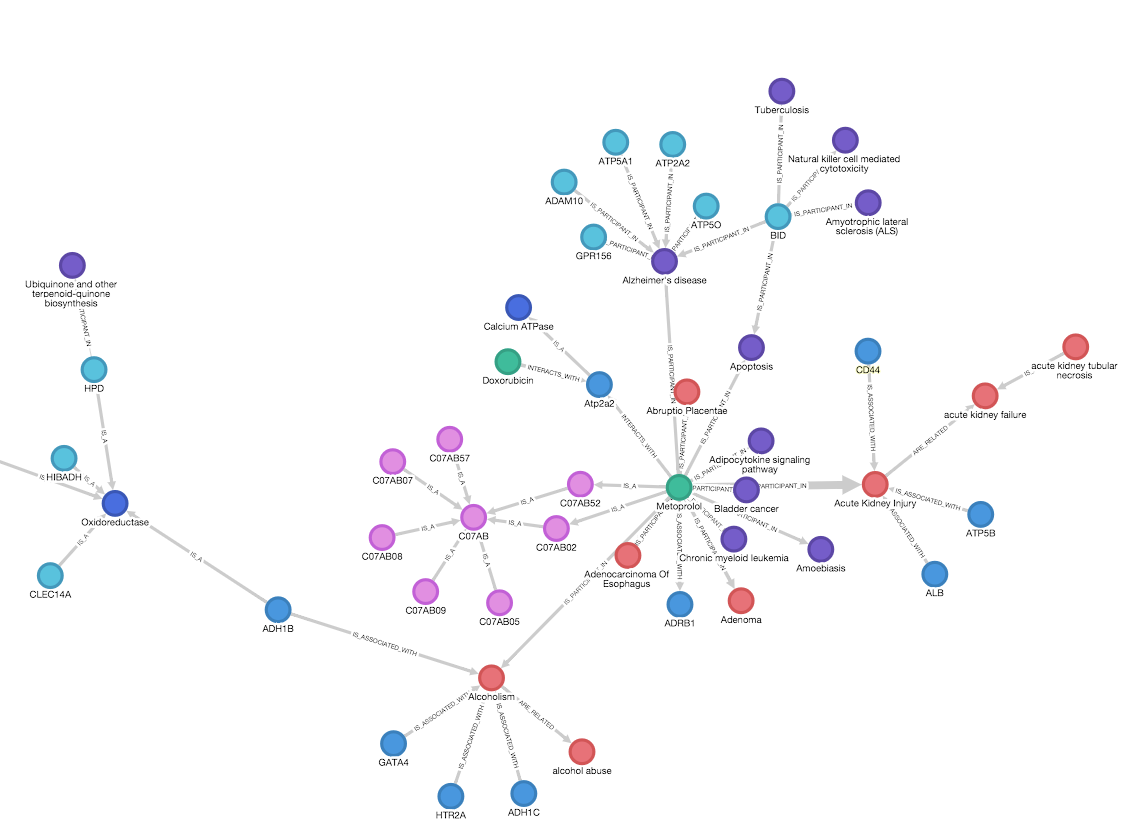
Scientific taxonomies and ontologies are fundamental to the organization of knowledge in scientific domains. Taxonomies classify concepts into hierarchical structures, facilitating understanding and communication. Ontologies, on the other hand, provide a framework for representing knowledge in a specific domain, defining the types, properties, and interrelationships of the entities within that domain. Since these are mostly tree-like, the cactus layout is ideal for navigation while keeping the global topology within the visualization canvas.
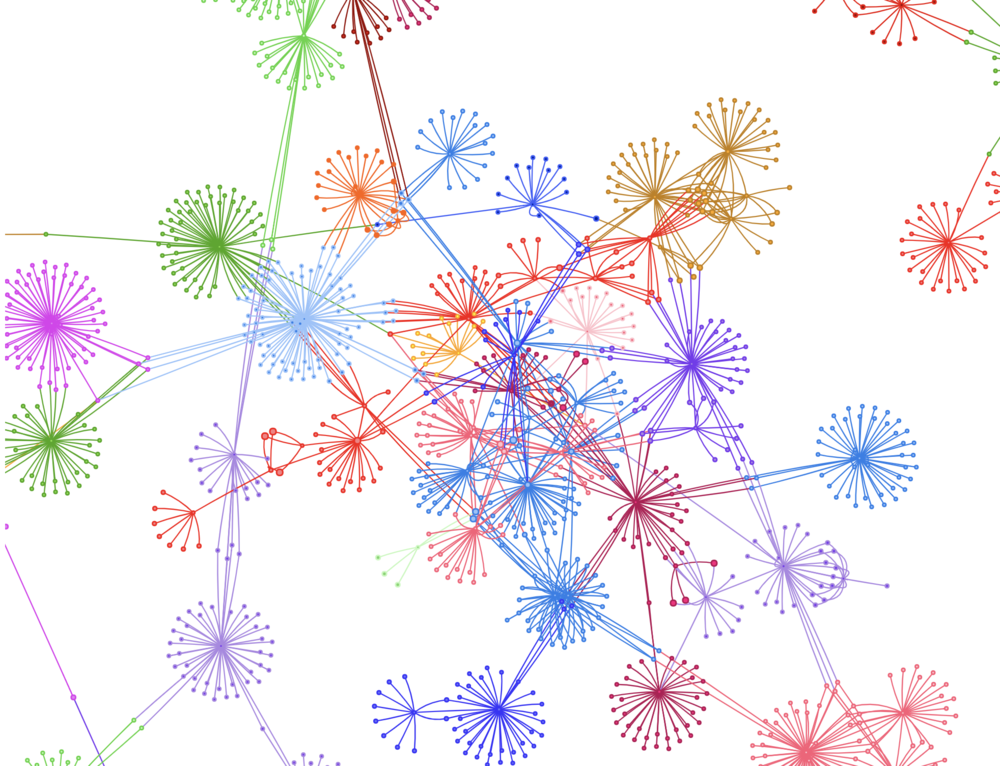
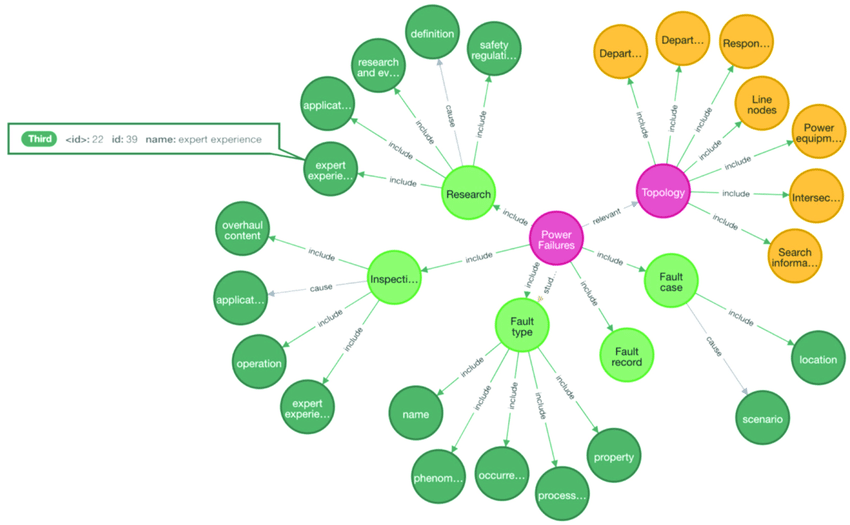
Social media analytics is a powerful tool for understanding consumer behavior and trends. By analyzing data from social media platforms, businesses can gain insights into customer preferences, sentiment, and engagement. This information can be used to inform marketing strategies, improve customer service, and drive business growth. The social clusters are a perfect fit for the cactus layout and emphasizes the subject (consumer, user) with its immediate (social) relationships while allowing via the flowing edges to see siblings and long-distance relations.
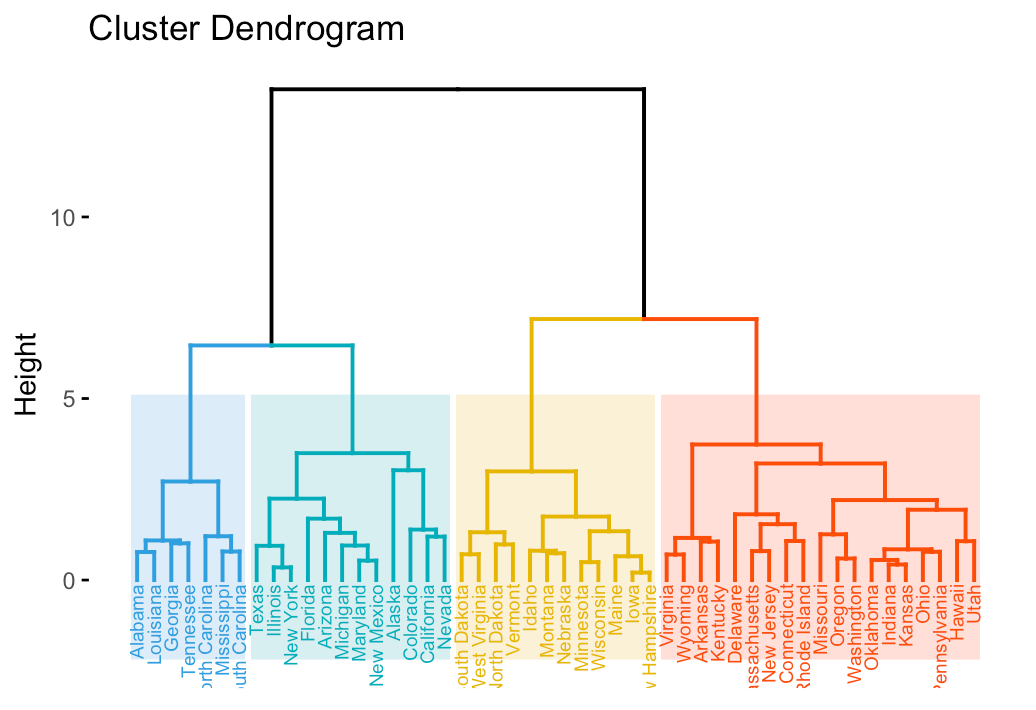
Cluster analysis in data science is a technique used to group similar data points together. It’s a crucial part of exploratory data analysis, helping to reveal patterns and structures within the data that may not be immediately apparent. Cluster analysis can be applied in various fields, from marketing (customer segmentation) to biology (gene expression studies), providing valuable insights and aiding in decision-making.
Technical Details
In the linked playground (basic cactus setup) you can see how easy one can set up a cactus layout. The recipe is as follows:
Data
If you have some JSON data, it should contain arrays for nodes and edges. Since the cactus layout really focuses on group hierarchies, you should also have group information inside the data. Typically this happens by specifying that some nodes are groups and the children point to these groups via a group id. In the example you can see that normal nodes have a groupId:
 {
      id: "n1",
      groupId: "g1"
}
and this grouId points to
{
      id: "g1",
      groupId: "g3",
      isGroup: true
}
and the isGroup field indicates that this node is a group. In the cactus layout, the group g1 will become a (filled) circle and the child n1 will be positioned at the rim of g1. yFiles comes with a convenient utility to easily convert JSON data to a graph. The GraphBuilder helps to load the data and map the necessary field to graph elements and properties:
const builder = new GraphBuilder(graph);
builder.createNodesSource({
  data: data.nodes.filter(u => !u.isGroup),
  id: "id",
  parentId: "groupId",

})
builder.createGroupNodesSource({
  data: data.nodes.filter(u => u.isGroup),
  id: "id",
  parentId: "groupId",

})
builder.createEdgesSource({
  data: data.edges,
  sourceId: "sourceId",
  targetId: "targetId"
})
builder.buildGraph()
Layout
With the data loaded and mapped to a graph, the layout is really as simple as:
const layout = new CactusGroupLayout();
await graphComponent.morphLayout(layout)
That is, you instantiate the layout class and hand it over to the graph component. It couldn’t be more simple!
Of course, there are plenty of ways to fine tune the layout and this can be done by passing an option object:
const layout = new CactusGroupLayout({
  // cactus layout options
})
This is, in fact, the generic approach in the yFiles framework. All layout algorithms can be applied and customized in this fashion.
Styling
Every element of the graph can be customized independently of the layout. The layout has as such no styling, it’s sole purpose is to arrange the graph elements. The overall appearance is, however, a combination of styling elements and layout. For example, you can specify that the layout should take the labels into account:
const layout = new CactusGroupLayout({
  integratedNodeLabeling: true
})
and this will take into account the size of the nodes and this does depend on the style (e.g. the font size affects the size of nodes).
This interplay between data and the various dimensions of a graph visualization (layout, style, design options, edge style…) is where the business context and some creativity comes in. It also engenders the user experience you wish to achieve and some technical know-how.
Playgrounds
This playground shows a basic setup and the use of bundling in cactus layout.
graph.nodeDefaults.style = new ShapeNodeStyle(
  {
    shape: "ellipse",
    stroke: null,
    fill: "steelblue"
  })
graph.groupNodeDefaults.style = new ShapeNodeStyle({
  fill: "silver",
  shape: 'ellipse',
  stroke: null
})
graph.edgeDefaults.style = new BezierEdgeStyle();

const data = {
  nodes: [
    {
      id: "n1",
      groupId: "g1"
    },
    {
      id: "n2",
      groupId: "g1"
    },
    {
      id: "n3",
      groupId: "g2"
    },
    {
      id: "n4",
      groupId: "g2"
    },
    {
      id: "g1",
      groupId: "g3",
      isGroup: true
    },
    {
      id: "g2",
      groupId: "g3",
      isGroup: true
    },
    {
      id: "g3",
      isGroup: true
    }
  ],

  edges: [
    {
      sourceId: "n1",
      targetId: "n2"
    },
    {
      sourceId: "n1",
      targetId: "n4"
    }
  ]
}
const builder = new GraphBuilder(graph);
builder.createNodesSource({
  data: data.nodes.filter(u => !u.isGroup),
  id: "id",
  parentId: "groupId",

})
builder.createGroupNodesSource({
  data: data.nodes.filter(u => u.isGroup),
  id: "id",
  parentId: "groupId",

})
builder.createEdgesSource({
  data: data.edges,
  sourceId: "sourceId",
  targetId: "targetId"
})
builder.buildGraph()
const layout = new CactusGroupLayout({
  integratedNodeLabeling: true
})

layout.edgeBundling.defaultBundleDescriptor.bundled = true
layout.edgeBundling.defaultBundleDescriptor.bezierFitting = true

await graphComponent.morphLayout(layout, '1s')