Organic Layout
Overview
Graphs are powerful tools for representing relationships, connections, and structures. The organic layout style is one of several approaches to arranging nodes and edges in a graph. Unlike other layout styles (such as hierarchical or force-directed), organic layouts emphasize a more natural and intuitive arrangement.
In organic graphs, nodes are positioned in a way that mimics natural patterns. Imagine leaves on a tree or constellations in the night sky—these organic arrangements inspire the layout. Nodes tend to form clusters, reflecting their inherent relationships. This natural distribution enhances readability and helps users identify related groups of nodes.
Symmetry plays a crucial role in organic layouts. Nodes are often symmetrically placed with respect to their neighbors. This symmetry creates a harmonious visual balance, making the graph aesthetically pleasing. Symmetry also aids in understanding the graph’s structure.
Organic graphs prioritize efficient use of space. Nodes are positioned close to their adjacent nodes, minimizing wasted space. This compact arrangement allows for larger graphs to fit within limited display areas.
Edges in organic graphs follow straight-line segments. Unlike force-directed layouts, which may have curved or bent edges, organic graphs maintain uniform edge lengths. This simplicity contributes to clarity and ease of interpretation.
Organic layouts strike a balance between aesthetics and functionality. Their natural distribution, symmetry, and space-saving properties make them valuable tools for understanding complex networks. Whether you’re exploring biological data or managing a large-scale system, organic diagrams offer insights into the intricate web of connections.
In addition to the standard organic graph structuring, the InteractiveOrganicLayout algorithm offers the capability to instantaneously reflect alterations within a graph’s visualization. Once modifications are finalized, the layout undergoes a localized update. This feature facilitates dynamic interaction with the graph layout as it evolves in real-time. A further benefit of this algorithm is its efficiency; for minor adjustments, there’s no need to recalculate the entire layout from scratch, saving both time and computational resources. ### Features
The Quality-Time-Ratio is a pivotal metric that allows users to balance the trade-off between the visual quality of a graph layout and the computation time required to achieve it. This ratio is highly flexible, enabling users to prioritize either a faster computation time at the expense of layout precision or a more refined layout that may take longer to compute.
When utilizing a layout algorithm that incorporates a PartitionGrid structure, it’s important to note that the algorithm is designed to accommodate only single partition cells for standard nodes, which are typically non-group nodes. Should there be a scenario where a PartitionGrid is present and the offspring of a group node are dispersed across different partition cells, or if group nodes are linked with a mode other than the standard NORMAL mode, the algorithm will halt and signal an InvalidGraphStructureError. This error acts as a safeguard to ensure that the graph structure adheres to the expected parameters for successful layout execution.
In the realm of graph layouts, the Avoidance of Node Edge Overlaps is a crucial feature that can be activated to minimize the intersections between nodes and edges. While this setting aims to reduce overlaps, it is not an absolute guarantee against their occurrence in the final layout. To further diminish the chances of overlaps, one can employ an edge routing algorithm post-layout, such as the OrganicEdgeRouter, which is specifically designed to reroute edges and enhance the overall clarity of the graph.
The Maximum Duration setting in the OrganicLayout algorithm is a useful tool for controlling the time spent on arranging large graphs. By setting a cap on the maximum duration, users can significantly cut down the runtime. However, it’s crucial to recognize that imposing such a limit might compromise the layout’s quality. Additionally, the actual runtime might slightly exceed the set maximum as the algorithm endeavors to locate a viable layout solution.
The algorithm’s ability to identify and style various substructures within a graph—such as chains, stars, cycles, parallel structures, trees, and group structures—is particularly noteworthy. These substructures are treated with specialized layout styles, ensuring they stand out for easy recognition within the graph. The algorithm also offers the flexibility to consider node types when detecting substructures, allowing only nodes of identical user-defined types to form a substructure.
Constraints play a significant role in influencing and limiting node placement within the graph. The layout algorithm supports a variety of constraints, including but not limited to the ones mentioned. For instance, nodes can be constrained to align along horizontal and vertical lines using the addAlignmentConstraint. In a given example, nodes labeled “H” would be aligned horizontally, while those labeled “V” would follow a vertical trajectory.
Moreover, nodes can be confined to specific geometric shapes, such as rectangles and ellipses, through the use of addRectangle and addEllipse constraints, respectively. In practice, nodes labeled “R” could be arranged within a square boundary, whereas nodes labeled “E” might be circumscribed within a circular area. The dimensions of these geometric forms are automatically calculated by the algorithm.
For expansive tree structures, a dedicated tree layout algorithm, like the BalloonLayout, is recommended to yield more appropriate results. Consequently, for graphs with tree-like characteristics, selecting an apt tree substructure style is advised. This choice delegates the layout of subtrees to a tree layout algorithm, ensuring a more coherent and visually appealing arrangement. ### Layout
The Organic Layout Algorithm is grounded in the principles of physics, particularly those related to force-directed paradigms. Nodes in a graph are treated as if they were physical objects, similar to charged particles such as protons or electrons. These nodes exert repulsive forces on each other, preventing them from overlapping and ensuring they are spaced out evenly across the layout.
The edges connecting the nodes are likened to metal springs. These springs can either attract or repel the nodes they connect, depending on their length. If an edge is too short, it will act to push the nodes apart; if it’s too long, it will pull them together. This dynamic adjustment of forces aims to reach an equilibrium where the graph looks balanced and aesthetically pleasing
The algorithm simulates the interaction of these forces and rearranges the nodes to minimize the total energy of the system. This process continues iteratively until a state of minimal energy, or a local minimum, is achieved. The resulting layout often reveals symmetric and clustered structures within the graph, with a well-balanced distribution of nodes and minimal edge crossings.
The Organic Layout Algorithm is optimized to reduce the risk of overlapping elements, ensuring that each node and edge is clearly visible. It also minimizes whitespace to provide a compact view of the network while maintaining clear distances between different connected components.
The algorithm is adept at identifying connected subnetworks within a larger network. It uses the three physical forces—repulsion, spring-like connections, and overall network energy—to optimally position these subnetworks. This is particularly valuable for visualizing larger, more complex networks, as it helps to untangle and clarify the relationships within the data.
In summary, the Organic Layout Algorithm uses a force-directed approach based on physical analogies to arrange graphs in a way that is both visually intuitive and reflective of the underlying data structure. It’s a dynamic process that adjusts node positions based on simulated physical forces until a visually coherent and structurally revealing layout is achieved. ### Business Domains
Bioinformatics:
- In bioinformatics, organic layouts help visualize biological networks, such as protein-protein interaction networks or metabolic pathways.
- Researchers can explore gene interactions, protein functions, and disease-related pathways more effectively.
Enterprise Networking:
For managing and representing network infrastructures within organizations, organic layouts offer advantages: - Clear depiction of network components (routers, switches, servers, etc.). - Identification of bottlenecks or critical nodes. - Improved communication among network administrators.
Knowledge Representation:
Organic layouts assist in mapping out knowledge domains and relationships: - Visualizing concepts, topics, and their interconnections. - Representing semantic networks or ontologies. - Enhancing knowledge management systems.
Systems Management:
In system architecture diagrams, organic layouts provide benefits: - Highlighting system components (servers, databases, services). - Showing dependencies and interactions. - Simplifying complex infrastructure for IT professionals.
WWW Visualization:
Understanding the structure of websites and internet connectivity becomes easier with organic layouts: - Visualizing web pages, hyperlinks, and content hierarchies. - Identifying clusters of related pages. - Enhancing user experience in web design.
Technical Details
Given a graph, running the layout is as simple as:
const layout = new OrganicLayout();
graphComponent.morphLayout(layout)
const layout = new OrganicLayout({
clusterNodes:false,
minimumNodeDistance:0,
compactnessFactor:.07
});There are really too many customization options to highlight here. Please consult the extensive documentation for the many parameters at your disposal. ### Playgrounds
▸ classic organic layout in ten lines
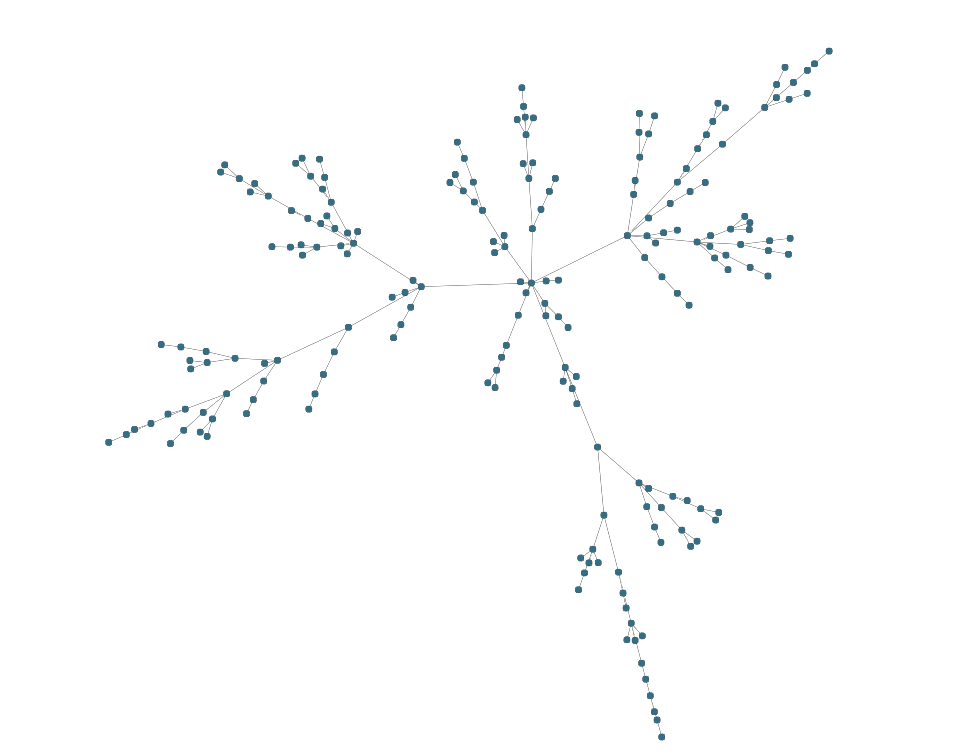
graph.edgeDefaults.style= new PolylineEdgeStyle({smoothingLength:20})
const nodeCount = 200
for (let i = 0; i < nodeCount; i++) {
graph.createNode( )
}
const nodes = graph.nodes.toArray()
for (let i = 1; i < nodes.length; i++) {
graph.createEdge(nodes[Math.floor(Math.random() * (i - 1))], nodes[i])
}
const layout = new OrganicLayout({
  clusterNodes:false,
  minimumNodeDistance:0,
  compactnessFactor:.07
});
await graphComponent.morphLayout(layout, '1s')▸ compact automatic clustering of nodes
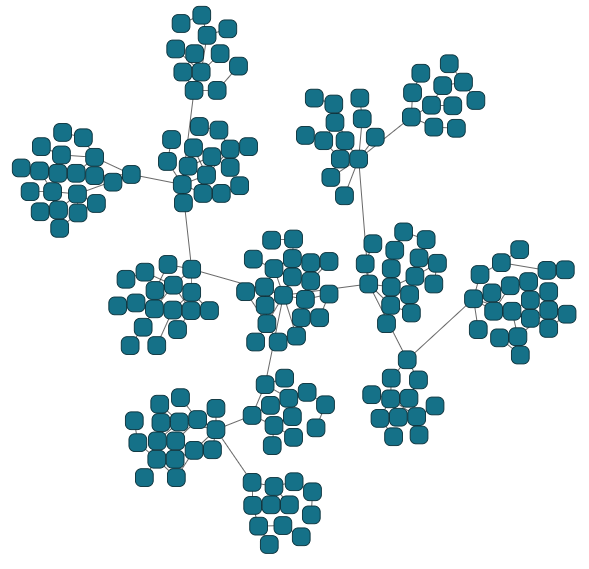
graph.edgeDefaults.style= new PolylineEdgeStyle({smoothingLength:20})
const nodeCount = 200
for (let i = 0; i < nodeCount; i++) {
  graph.createNode( )
}
const nodes = graph.nodes.toArray()
for (let i = 1; i < nodes.length; i++) {
  graph.createEdge(nodes[Math.floor(Math.random() * (i - 1))], nodes[i])
}
const layout = new OrganicLayout({
  clusterNodes:true,
  minimumNodeDistance:0,
  compactnessFactor:.7
});
await graphComponent.morphLayout(layout, '1s')