Cora
A straightforward ML example using Mathematica to learning connectivity in the Cora dataset.
You can learn about the Cora dataset here.
Author: Francois Vanderseypen, Orbifold Consulting (https://orbifold.net).
Last update: July 2023.
Data Setup
Set the base path for the data and let’s download the two Cora files (Cora.cites and Cora.content) via the link provided links in the article above:
The edges are contained in the TSV-formatted “cora.cites” file:
![]()
A sample shows that the edges are just tuples:
![]()
![]()
The node content sits in the “cora.content” files and can be imported in a similar fashion:
![]()
The textual content is already encoded and the last entry represent the label (of the encoded article)
![]()
![]()
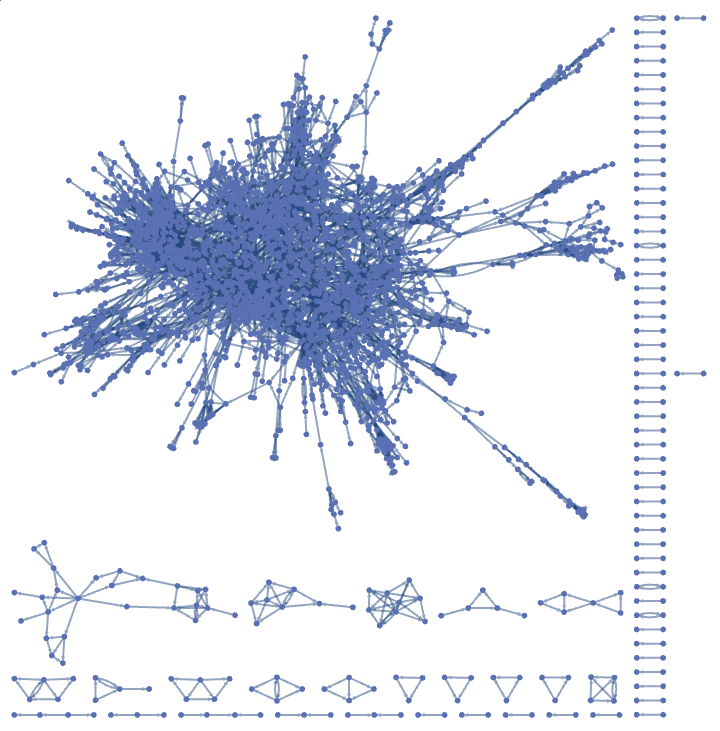
The graph from the edges is simply
![]()
Mathematica has no issue rendering the graph:
![]()
Learning
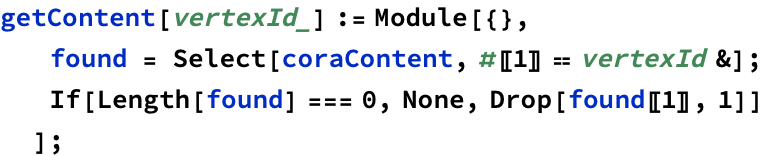
This gets the content of a single node
In order to reduce dimensionality we’ll fetch a reducer
![]()
A reducer in Mathematica is really an embedding, so this reducer is actually a node embedding. It’s not as good a real node2vec because the topology is not taken into account. If you really wish to reproduce that you would have to implement biased random walks in order to linearize the local neighborhood of each node and thereafter use the reducer to encode the payload with the topology of the nodes. This would produce a much better model than the one created here.
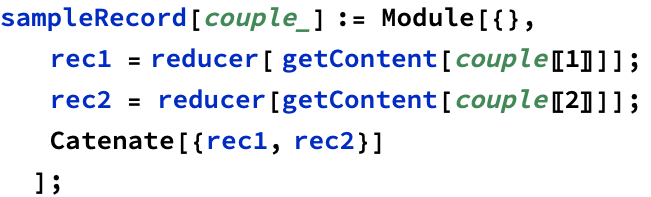
For a given tuple this will return one record combining the data contained in the corresponding nodes
Tells you whether the tuple represents an edge in the graph
![]()
Returns the specified amount of tuples, each tuple being an edge in the graph
![]()
The same for disconnected nodes
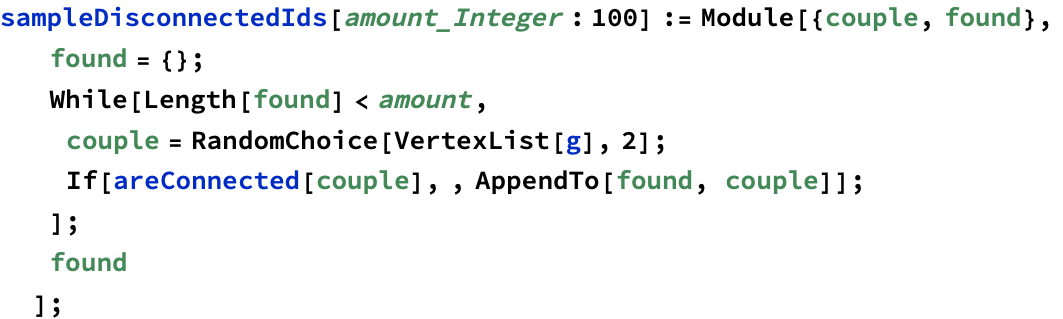
Finally, this samples data suitable for machine learning. The binary classification corresponds to a 1 if there is an edge for the combined data and 0 otherwise
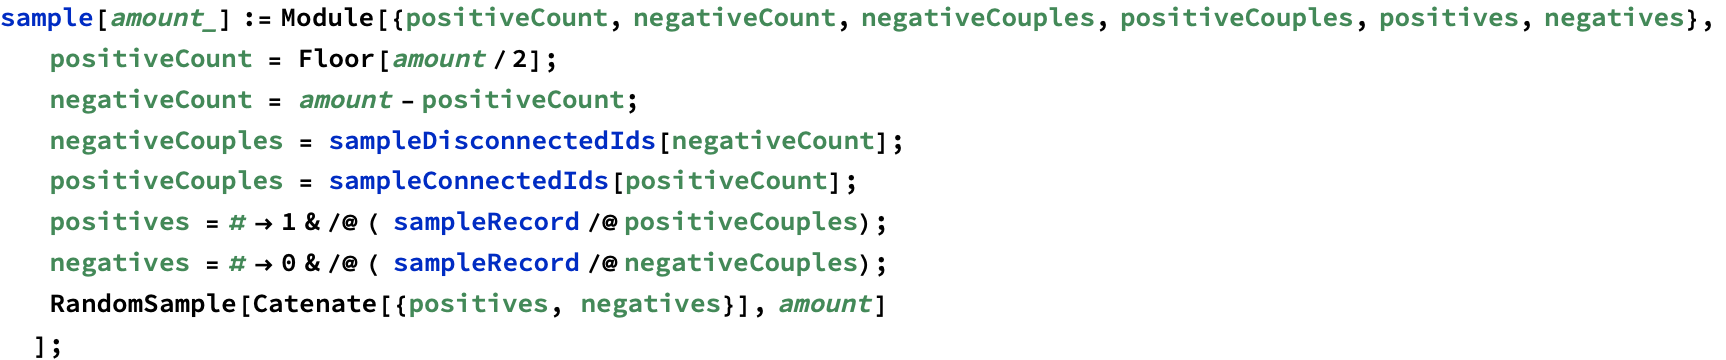
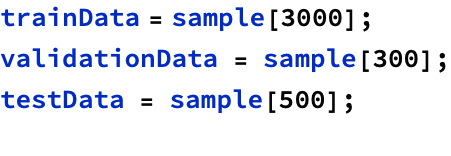
Sampling the train, test and validation data. Note that we ensured in the sampling that there are as many positives as negatives.
![]()
![]()
![]()